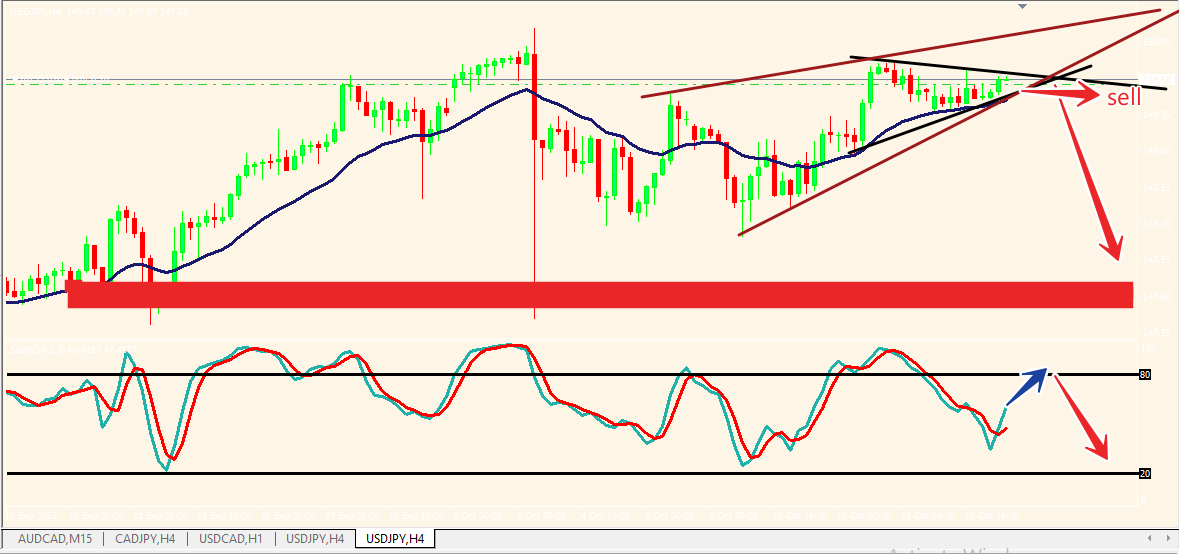
Trading recommendations for the USD/JPY for October 17–18, 2023: sell below 149.51 (the symmetrical triangle that represents the 21 SMA).
Maximize your profit by copy our trade
1. Current Trading Conditions: Early in the European session, the USD/JPY pair is trading around 149.55. It is positioned above the 21-period Simple Moving Average (SMA) but below the 4/8 Murray level.
2. Symmetrical Triangle Pattern: On the 4-hour chart, a symmetrical triangle pattern has formed in the Japanese yen. This pattern typically indicates a period of consolidation and suggests that a breakout is imminent.
3. Bearish Scenario: In the next few hours, a sharp break below the 21 SMA and the uptrend channel formed since October 6 is expected. If this bearish scenario unfolds, the Yen is expected to trade below 149.50, and the USD/JPY pair could potentially reach the 200-period Exponential Moving Average (EMA) located at 148.11.
4. Bullish Scenario: On the other hand, a bullish scenario is possible if the yen consolidates above 150.16, which is the Yearly High and the 8/8 Murray level. In this case, the USD/JPY pair could potentially reach the +1/8 Murray level at 151.56.
5. Main Trend and Exhaustion: The main trend for the USD/JPY pair remains bullish. However, there are signs of exhaustion in the market, suggesting a potential correction. It is important to wait for the yen to fall below 149.50 before considering selling positions. The target levels for such a correction would be at 148.43 and 148.11.
6. Pullback Opportunity: If a pullback occurs towards the psychological level of 150 and fails to break it, it would be seen as an opportunity to sell positions in anticipation of a bearish move.
Please note that this analysis is based on the information provided and does not constitute financial advice. It is always recommended to conduct thorough analysis and consider multiple factors before making any trading decisions.
