Maximize your profit by copy Our Trade
What Is a Trend Line?
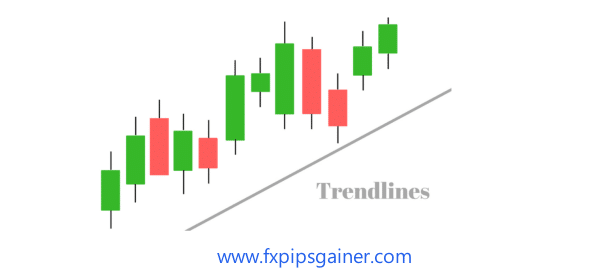
A trend line is a straight line that connects two or more price points on a chart, representing the direction of price movement over time. It helps traders identify the overall direction of the market (uptrend, downtrend, or sideways) and potential support and resistance levels.
How and Why We Use Trend Lines in the Forex Market
- Identify Market Direction: Trend lines help traders determine whether the market is in an uptrend, downtrend, or ranging.
- Support and Resistance: They can indicate potential areas where the price may reverse or breakout.
- Entry and Exit Points: Traders use trend lines to find potential points to enter or exit trades.
- Visual Clarity: They provide a simple visual representation of price behavior, making analysis easier.
Types of Trend Lines
- Uptrend Line: Drawn by connecting two or more higher lows; indicates a bullish market.
- Downtrend Line: Drawn by connecting two or more lower highs; indicates a bearish market.
- Horizontal Trend Line: Drawn along horizontal levels where price fails to break; indicates a ranging market.
Best Timeframes for Trend Line Trading Strategy
- H1 (Hourly): Suitable for swing traders looking to capture bigger moves.
- H4 (4-Hour): Ideal for identifying longer-term trends with fewer false signals.
- D1 (Daily): Best for long-term traders who want to capture major price movements.
Conclusion
Trend lines are essential tools for forex traders, providing insights into market direction, potential support and resistance, and ideal entry and exit points. Choosing the right timeframe enhances the effectiveness of the trend line strategy, helping traders make informed decisions.


