Maximize your profit by copy Our Trade
Evening Star Forex Pattern
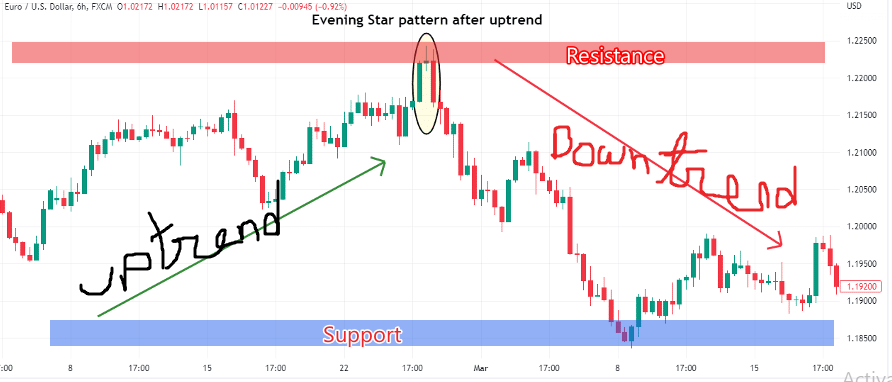
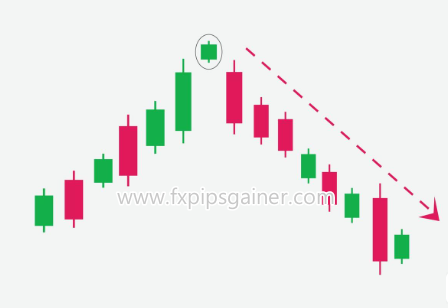
The Evening Star is a significant candlestick pattern used in forex trading to identify potential bearish reversals. This pattern consists of three candlesticks and is typically found at the peaks of bullish trends.
Components of the Evening Star Pattern
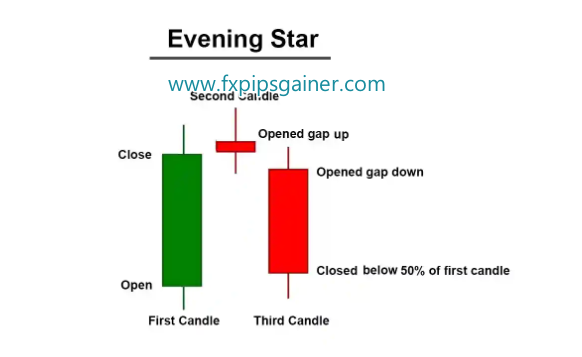
1. First Candlestick
A large green candlestick that closes higher, indicating strong buying pressure.
2. Second Candlestick
A smaller body candlestick (could be red or green) indicating indecision in the market. This candlestick often gaps up from the first candlestick’s close but reflects a weakening buying momentum.
3. Third Candlestick
A large red candlestick that opens lower and closes below the body of the first candlestick. This signals a takeover by sellers and confirms the reversal.
Interpretation of the Evening Star Pattern
Meaning
The Evening Star pattern suggests that the bullish trend is losing momentum and a bearish reversal may follow. The pattern indicates a shift in control from buyers to sellers.
Market Psychology
First Candle: Buyers dominate as the market pushes higher.
Second Candle: The small body reflects uncertainty; neither buyers nor sellers gain definitive control.
Third Candle: Sellers overpower buyers, driving prices lower often with an increase in trading volume.
How to Trade the Evening Star Pattern
Step-by-Step Trading Approach
1. Identify the Pattern: Look for the three-candle formation at the peak of an uptrend.
2. Volume Confirmation: Observe the volume during the third candlestick. An increase signifies strong selling pressure.
3. Entry Order: Place a sell order a few pips below the close of the third red candlestick. Ensure volume on the third candlestick is greater than the previous two candlesticks.
4. Stop-Loss Setting: Set a stop-loss a few pips above the second candlestick (the one with the smaller body).
5. Take Profit Target: Place a take-profit target that is at least twice the distance of your risk for the trade (risk-to-reward ratio of 1:2).
Example Scenarios
Example 1: A well-formed Evening Star pattern appears at the end of a bullish trend, the third candlestick shows high volume, indicating a solid setup for a bearish position.
Example 2: An Evening Star pattern forms but the third candlestick does not have a larger body. While this might seem less ideal, as long as volume is higher than the previous days, it can still be seen as a valid signal.
Additional Tips
Flexibility in Patterns: Patterns do not always appear “perfect.” Adapt your interpretation based on price action and volume analysis.
Break of Support: The third red candlestick should ideally break below the low of the first green candle to confirm the reversal.
Trading with the Evening Star Pattern Near the 100 EMA
Combining the Evening Star pattern with the 100 EMA can enhance your trading strategy for identifying bearish reversals, especially when the market is in an uptrend and approaching the 100 EMA as a resistance level.
Strategy Overview
- Market Context: Confirm that the market is in an uptrend and approaching the 100 EMA as a resistance level.
- Evening Star Formation: Look for the Evening Star pattern forming at or near the 100 EMA.
- Prepare for Sell Entry: Set up your trade metrics based on this confirmation.

Step-by-Step Trading Strategy
1. Identify Market Conditions
Uptrend Confirmation: Ensure the price has been making higher highs and higher lows.
Approaching 100 EMA: The price should be nearing the 100 EMA, indicating a potential area of resistance.
2. Locate the Evening Star Pattern
Look for the Evening Star formation:
- First Candlestick: A large green candle indicates strong buying.
- Second Candlestick: A smaller-bodied candle (red or green) that shows indecision.
- Third Candlestick: A large red candle signaling a bearish reversal.
3. Confirm the Position Relative to 100 EMA
The Evening Star pattern should form at or near the 100 EMA. This reinforces the significance of this resistance level.
4. Check Volume
Analyze the volume during the third candlestick. Higher volume indicates stronger selling pressure and validates the reversal.
5. Entry, Stop-Loss, and Take Profit Setup
- Entry Order:
Place a sell order a few pips below the close of the third red candlestick. - Stop-Loss:
Set a stop-loss a few pips above the high of the second candlestick (small body). - Take Profit:
Determine a take-profit target that is at least twice the risk (e.g., if risking 50 pips, aim for a 100-pip profit).
6. Monitor the Trade
Keep an eye on price action and volume as the trade progresses. Consider adjusting the stop-loss to break even once the market moves favorably.
Example Scenario
Market Context: The price has been in an uptrend and is nearing the 100 EMA.
Evening Star Formation: A clear Evening Star pattern forms at the 100 EMA:
- First candle is a large green candle.
- Second candle is a small body, indicating indecision.
- Third candle is a large red candle closing below the first.
Trade Setup:
- Sell order placed below the third candle.
- Stop-loss set above the second candle.
- Take-profit target established at a distance twice the risk.
When the market is in an uptrend and the 100 EMA acts as resistance, an Evening Star pattern can indicate a strong bearish reversal. By confirming the pattern and setting appropriate entry and risk management levels, traders can effectively harness this strategy for profitable trades. Always remain vigilant and adaptable to changing market conditions.
Differences Between Evening Star and Morning Star Candlestick Patterns
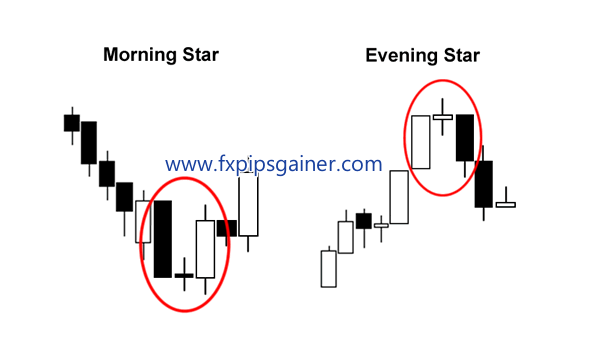
| Feature | Evening Star | Morning Star |
|---|---|---|
| Market Context | Indicates a potential reversal after an uptrend | Indicates a potential reversal after a downtrend |
| Candlestick Sequence | Long white candle, followed by a short candle, then a long black candle | Long black candle, followed by a short candle, then a long white candle |
| First Candle | Long white candle (strong bullish activity) | Long black candle (strong bearish activity) |
| Second Candle | Short black or white candle (indecision) | Short black or white candle (indecision) |
| Third Candle | Long black candle (confirms bearish reversal) | Long white candle (confirms bullish reversal) |
| Market Sentiment Shift | Shifts from bulls to bears | Shifts from bears to bulls |
| Confirmation | The third candle closes significantly lower | The third candle closes significantly higher |
| Interpretation | Signals potential selling opportunity | Signals potential buying opportunity |


