


Ichimoku Indicator can be very overwhelming for new traders.But the truth is that if we can understand this indicator we can reap massive rewards.So in this article I will go over what is the ichimoku indicator and I will also share a very simple strategy using it.So first we need to know what is ichimoku cloud indicator .
The ichimoku cloud is a combination of different indicators that can help us in identifying support and resistance levels.
We can also identify the trend and momentum of the market with ichimoku indicator.
The Ichimuko is an indicator that been gaining popularity in recent years, especially among forex traders.
For its versatile uses it known as an “all in one Indicator”
As we begin to understand what the different components of this indicator represent ,you will see how powerful and versatile it can be.
The word Ichimuko literally translates to meaning “one look”.
It was designed to that traders could take one look at this indicator to help gain many valuable insights-
Such as:
#Amount of the momentum of the market.
#Future areas of support and resistance.
# Entry and exit locations.
Lets add the ichimuko Indicator to our charts and go through step by step what each of the individual components do.
1.Tenkan Sen(Convension Line).
2.Kijun sen(Base Line).
3.Senkou Span-A(Leading Span A).
4.Senkou Span-B(Leading Span B).
5.Chikou Span.
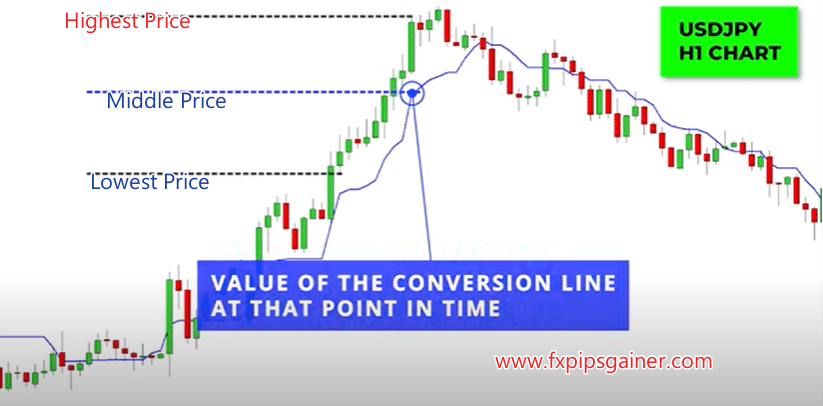
Tenkan-Sen line is also known as Convension Line.
This convension line is calculated by taking the mid-point of the highest high and the lowest low over the last 9 periods/candles.
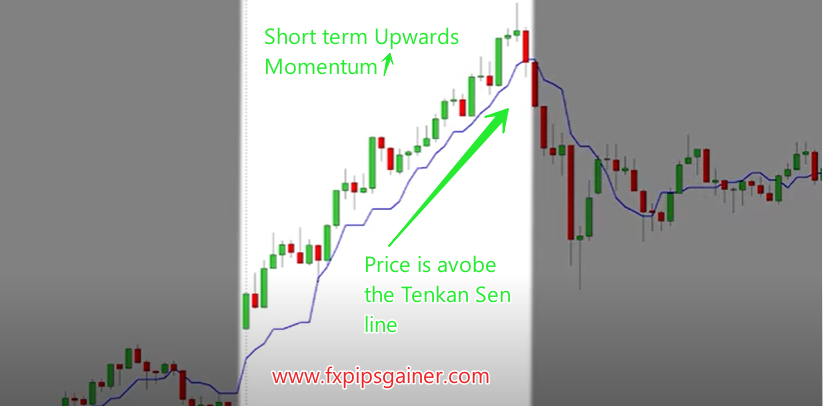
The convension line helps measure the short-term trend in the market,and can also act as an area of minor support & resistance.
#When price is above the convension line and the convension line is sloping upwards this indicates that we have short-term upwards momentum in the market.
#When Price is below the convension line and the convension line is sloping downwards this indicates that we have short-term downwards momentum.
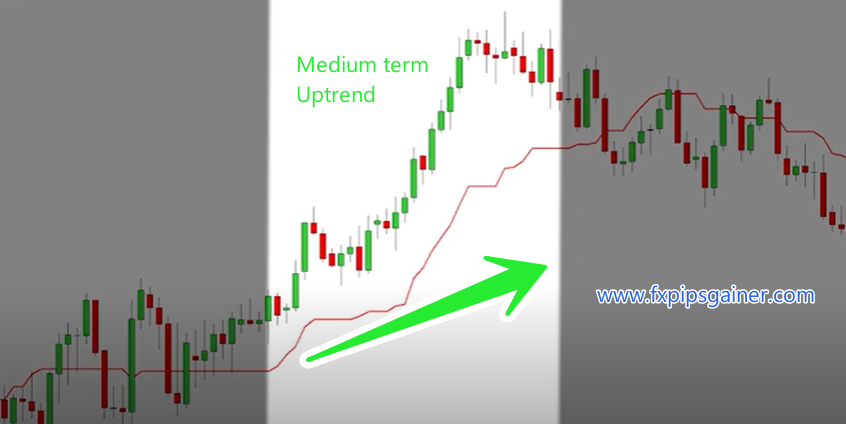
The base line is calculated by taking the mid-point of the highest high and the lowest low over the past 26 periods.
The base line helps measure the medium-term trend in the market.It also acts as a form of medium -term support and resistance.
Some traders even use the base line as a way to trail their stop loss.
#When price is above the base line and the baseline is sloping upwards this indicates that we have medium-term upwards momentum in the markets.
#When price is below the baseline and the baseline is sloping downwards this indicates that we have medium term downwards momentum in the markets.
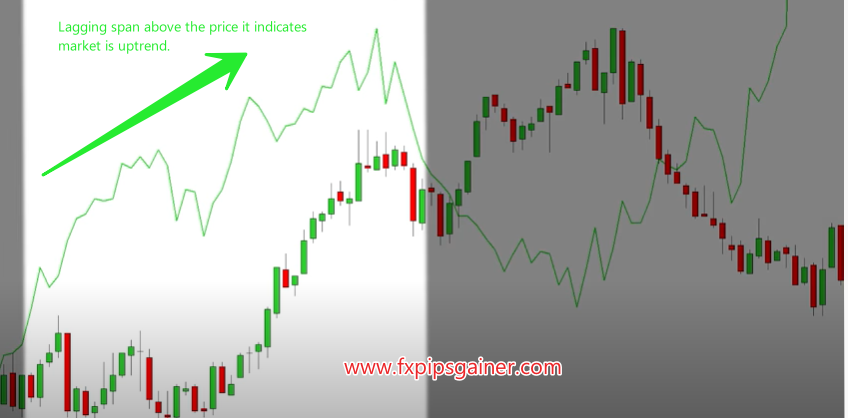
The lagging span is calculated by plotting closing prices 26 periods behind the current prices.
So for example here we have a one minute chart of the euro dollar as you can see the lagging span is being plotted 26 minutes behind each candle close.
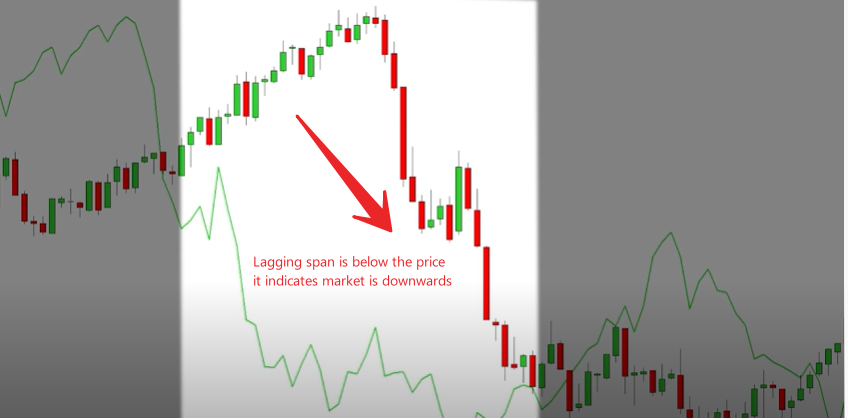
When the lagging span is above price this indicates that we have a bullish bias.When the lagging span is below price this indicates that we have a bearish bias.
The lagging span can also help spot potential trend reversals as it crosses through price.
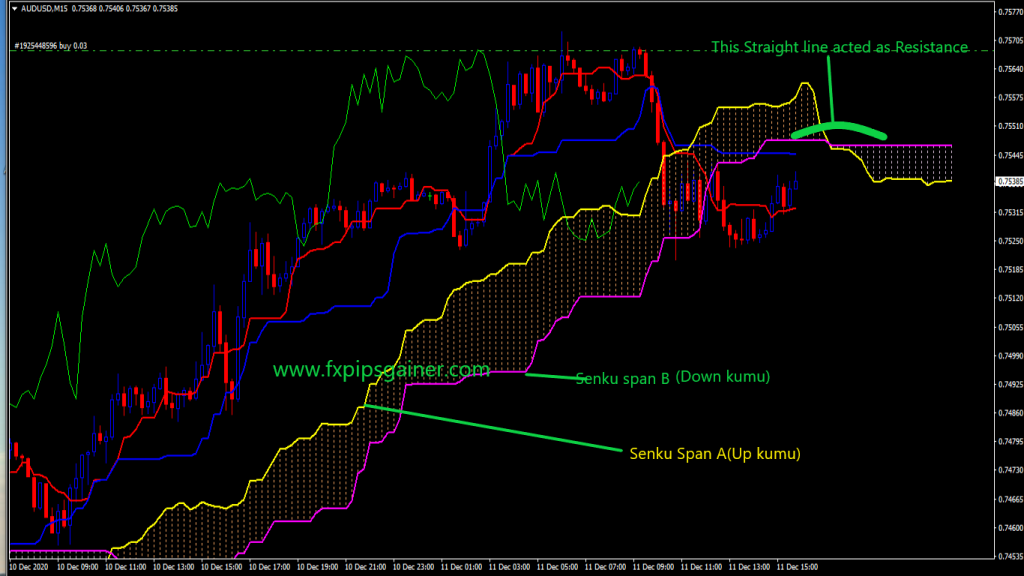
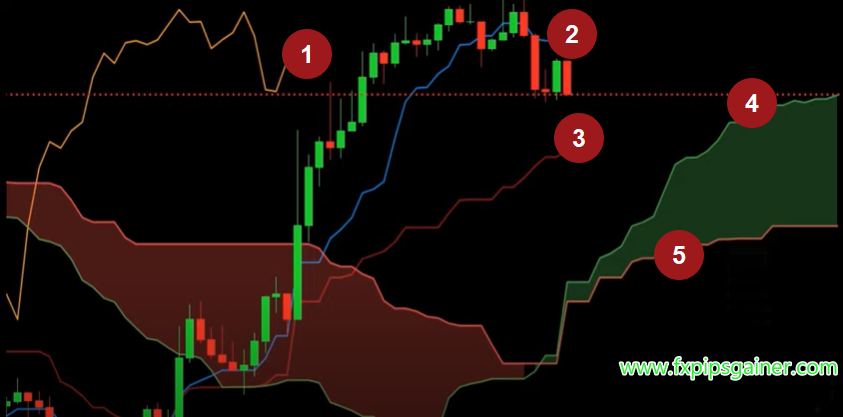
Kumo cloud consist of two span
A.Senko Span A(Leading Span A)
B.Senko Span B(Leading Span B)
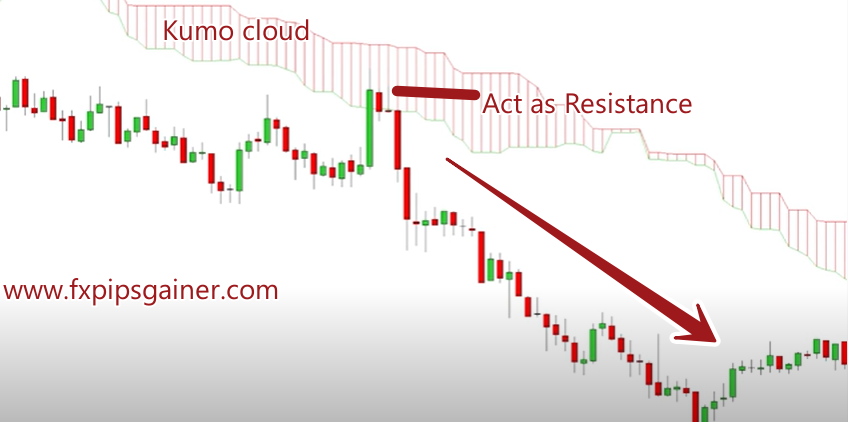
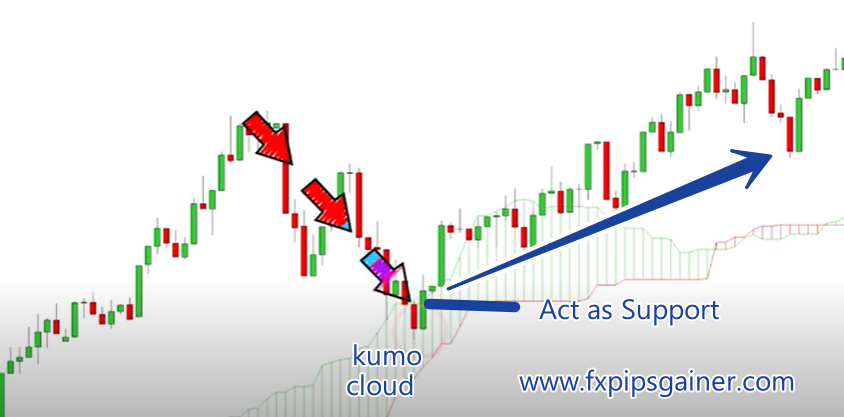
The kumo cloud acts as a form of dynamic support and resistance.
When price above the kumo cloud we could look to take buy trades as price moves down into the cloud.
When price is below the kumo cloud we would look to take sell trades as price moves up into the kumo cloud.
When kumo cloud is wide we expect the support & resistance provides to be strong.
When kumo cloud is narrow we expect the support & resistance it provides to be weak.
Its important that we remember the following points:
#When using the ichimoku indicator we should be looking to trade in the direction of the trend.
#By making sure we avoid trading against the trend and stepping aside when price is moving mostly sideways,we can ensure that we are taking high probability trade setups.
When leading span A is above leading span B this indicates to traders that price momentum is currently increasing. When this is the case ,the graph will be shaded green.
On the other hand, when leading span A is below the leading span B the underlying asset is likely moving in a negative direction, when this happens, the cloud will be shaded red. Despite the graph complications simply looking at the colors of the cloud can help you determine the direction of the market.
Here are some basic interpretations of the ichimoku charts:
We are in a bullish trend when the price is below the cloud.
We are in a bearish trend when the price is above the cloud.
When the price is in the middle of the cloud the trend is consolidating or ranging. Furthermore, the ichimuko charting technique provides bullish and bearish signals of various strengths.
When the tenkan crosses kijun from below it is considered a bullish signal.
When the tenkan crosses the kijun from above it is considered a bearish signal.