Maximize your profit by copy our trade
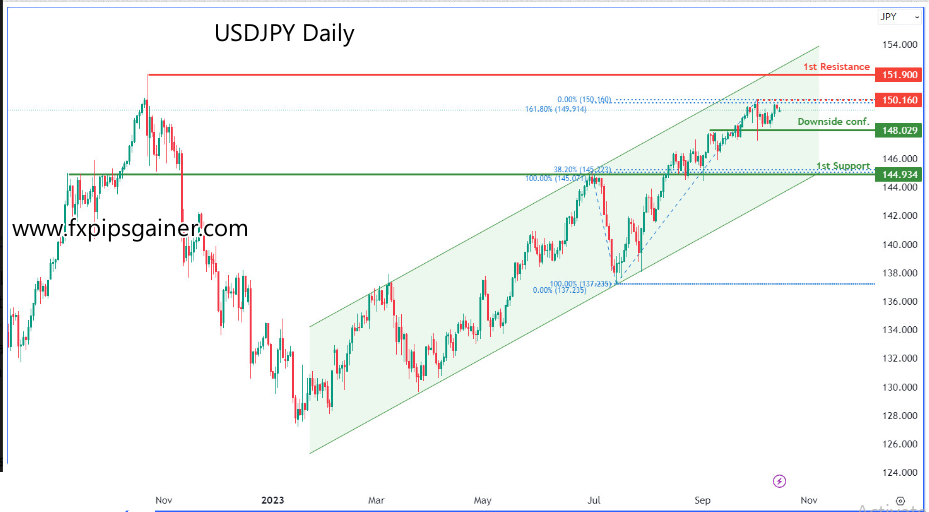
The analysis suggests that USD/JPY is displaying bullish momentum within an ascending channel. This indicates that the price of the currency pair is generally trending higher.
The first support level is identified at 144.93. This level is aligned with the 38.20% Fibonacci Retracement, which is a commonly used technical analysis tool. The Fibonacci retracement levels are based on the idea that price tends to retrace a portion of its previous move before continuing in the direction of the trend.
The analysis suggests that the 1st support level at 144.93 may provide strong support for USD/JPY. This means that there is significant buying interest or demand at this level, which could potentially prevent the price from declining further.
The overlap support is identified at 148.02. This means that there is another level of support near the price of 148.02, which reinforces the strength of the support at 144.93. The presence of multiple support levels in close proximity suggests that there is a higher likelihood of prices bouncing higher from this area.
The first resistance level is identified at 151.90. This level is acting as a swing-high resistance, which means that the price has previously struggled to move above this level. Swing highs are typically areas where selling pressure increases and may act as barriers to further bullish advances.
The analysis suggests that the 1st resistance level at 151.90 coincides with the 161.80% Fibonacci Extension. Fibonacci extensions are used to project potential price targets beyond the original trend. In this case, the 161.80% extension level indicates a potential area where the price could encounter resistance and reverse its upward movement.
The analysis suggests that XAU/USD is displaying bullish momentum after breaking a descending resistance line. This indicates a potential shift in the trend from bearish to bullish, with the price of gold against the US dollar expected to move higher.
The first support level is identified at 1889.42. This level is considered a pullback support, meaning that it represents a price level where buyers are likely to step in and prevent further downward movement. It is expected to provide strong support for XAU/USD.
The analysis indicates that the 1st support level at 1889.42 is a strong support level. This suggests that there is significant buying interest or demand at this level, which reinforces its ability to hold as support.
The 2nd support level is identified at 1808.81. This support level reinforces the support zone created by the 1st support level at 1889.42. The presence of multiple support levels in close proximity further strengthens the potential for a strong support zone.
The first resistance level is identified at 1982.09. This level is considered an overlap resistance, meaning that it has previously acted as a barrier to upward price movement. It is expected to impede further bullish advances in XAU/USD.
The analysis suggests that the level of 1946.68 acts as a confirmation overlap resistance. This means that it adds to the significance of the 1st resistance level at 1982.09, further reinforcing the potential for a strong resistance area.
Ins
Ins