H4 entry from D1 Support and Resistance Trading System
For this trading system we need to indicator one is arrow signal indicator and another is support resistance indicator.
Current Time Frame need to set H4 and only only H4
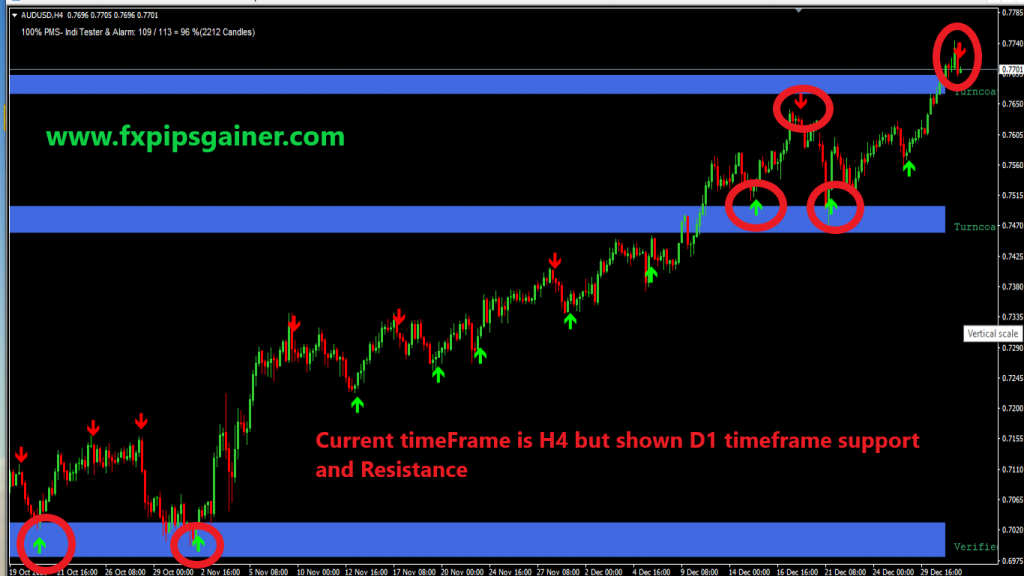
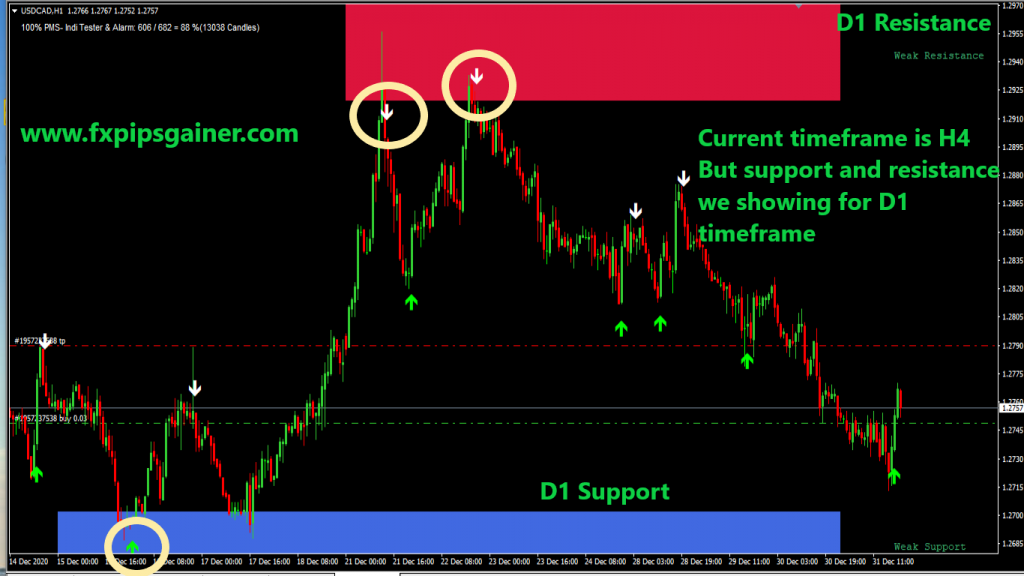
When you set my template on your chart automatically we will see D1 timeframe support and resistance.
If not clear try to see our picture .
Picture will help you to clear everything’s.
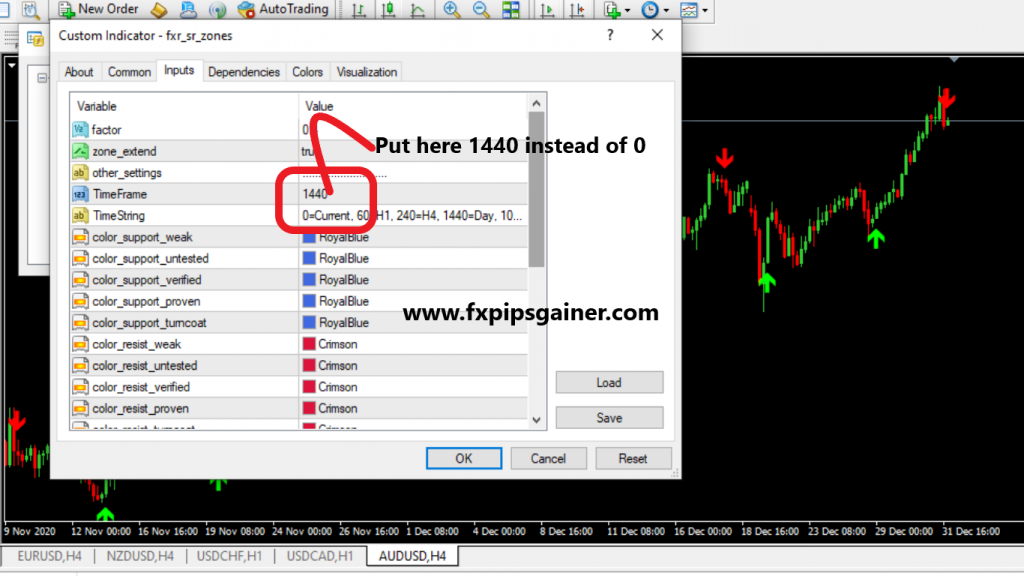
When you set our template please try to check the indicator setting (Support and resistance indicator),after set the template.
If timeframe show 0 please change like 0 to 1440.
Confirm by check.
If you show 1440 timeframe that means any current timeframe you will see D1 support and resistance.
Our vision to show D1 support and resistance in any current timeframes.
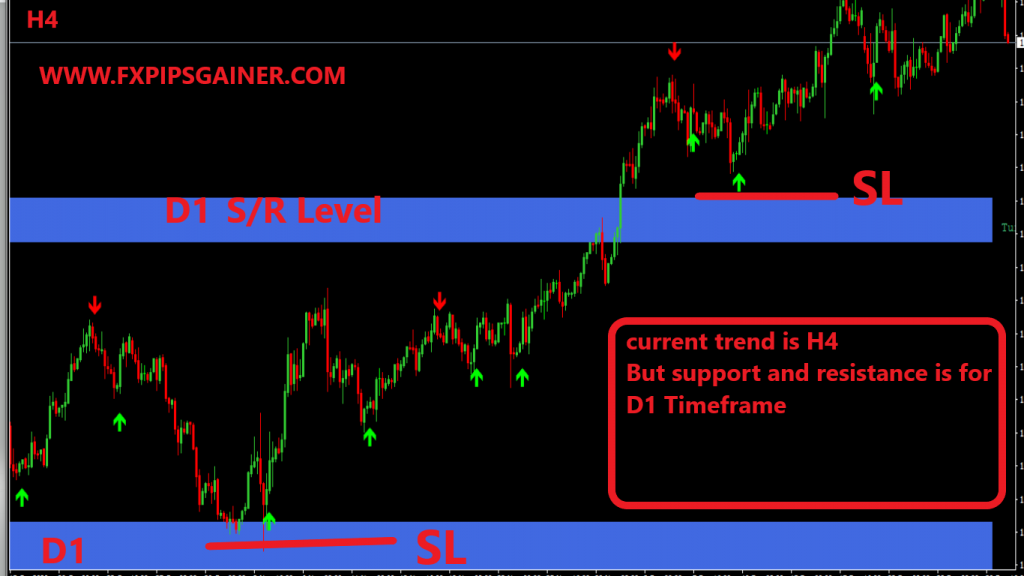
We will set it on H4 timeframe.So our current timeframe is H4 but our support and resistance level is from D1 timeframe.
Where our stop loss:
It is just 6/8 pips behind or above the signal arrow.
Take Profit:
2/3 times of the stop loss. Breakeven we can use after 2 times of our profit.
If our stop loss 30 pips. Our profit target will be 60-90 pips.
It is the excellent system of price action.
How much Accuracy you could not imagine. It may 80%+
Risk ratio is very high.
Recent Posts
- Golden Scalping Strategy
- How to Trade Supply and Demand Zones in Forex Using SMC Strategy
- Binary Trading vs Forex: Gambling or Real Business?
- Professional Copy Trading Service Using Real Money Accounts
- Why You Should Avoid Sell Entries in Gold Trading
- Safe Gold Trading Strategy for XM Micro Accounts (Up to 12 Entries)
- What is a Cent Account?
- Smart Money Concepts: Mastering Mitigation Blocks, Breaker Blocks & QML
- Understanding ICT Reclaimed Order Blocks: How Institutions Control Market Moves
- How to Trade Consolidations in Forex and Other Markets
Archives
- January 2026 (1)
- December 2025 (6)
- November 2025 (15)
- October 2025 (8)
- May 2025 (3)
- April 2025 (3)
- March 2025 (1)
- December 2024 (1)
- November 2024 (2)
- October 2024 (16)
- September 2024 (28)
- August 2024 (66)
- July 2024 (19)
- February 2024 (1)
- November 2023 (1)
- October 2023 (17)
- September 2023 (6)
- August 2023 (5)
- March 2023 (1)
- September 2022 (6)
- August 2022 (16)
- July 2022 (5)
- June 2022 (4)
- May 2022 (17)
- April 2022 (13)
- March 2022 (12)
- February 2022 (17)
- January 2022 (5)
- December 2021 (1)
- November 2021 (9)
- October 2021 (4)
- September 2021 (14)
- January 2021 (12)
- December 2020 (55)
- November 2020 (98)


