Markets don’t always trend. In fact, most of the time, price moves sideways within a range. These periods of hesitation are called consolidations, and understanding how to trade them can significantly improve your consistency as a trader.
Consolidation trading is about patience and precision — waiting for the market to show its hand before taking action. Let’s explore what consolidations are, why they matter, how to identify them, and most importantly, how to trade them effectively.
What Is a Consolidation?
A consolidation occurs when price moves within a confined range, unable to make new highs or lows. It’s a pause in market direction — a moment of indecision between buyers and sellers. During this phase, market participants reassess, large traders position themselves, and liquidity builds up before the next significant move.
Consolidations can happen:
After a strong bullish or bearish trend (as the market “rests”)
Before or after major news events
Around key support and resistance levels
In the middle of a longer trend (trend continuation)
At major peaks or troughs (potential reversals)
In Forex, consolidation periods are often used by institutional players to accumulate (buy) or distribute (sell) large positions quietly — before a strong breakout.
Trade Now
Why Consolidation Matters
For traders, consolidation is not a boring phase — it’s an opportunity. These periods reveal where big traders are positioning and where liquidity is building. Once that pressure releases, strong directional moves follow.
Key advantages for traders:
Tighter stop-loss placement due to narrow price movement
High reward-to-risk (R:R) potential when trading breakouts
Clear entry and exit zones (support and resistance boundaries)
Reduced market noise compared to volatile trends
However, entering too early or without confirmation can lead to losses from false breakouts, which are common during consolidations.
Common Types of Consolidation Patterns
Consolidations can take different shapes on the chart, depending on market behavior. Recognizing them early helps traders plan their trades strategically.
1. Ranges (Rectangular Consolidations)
The simplest and most common pattern — price moves between horizontal support and resistance levels.
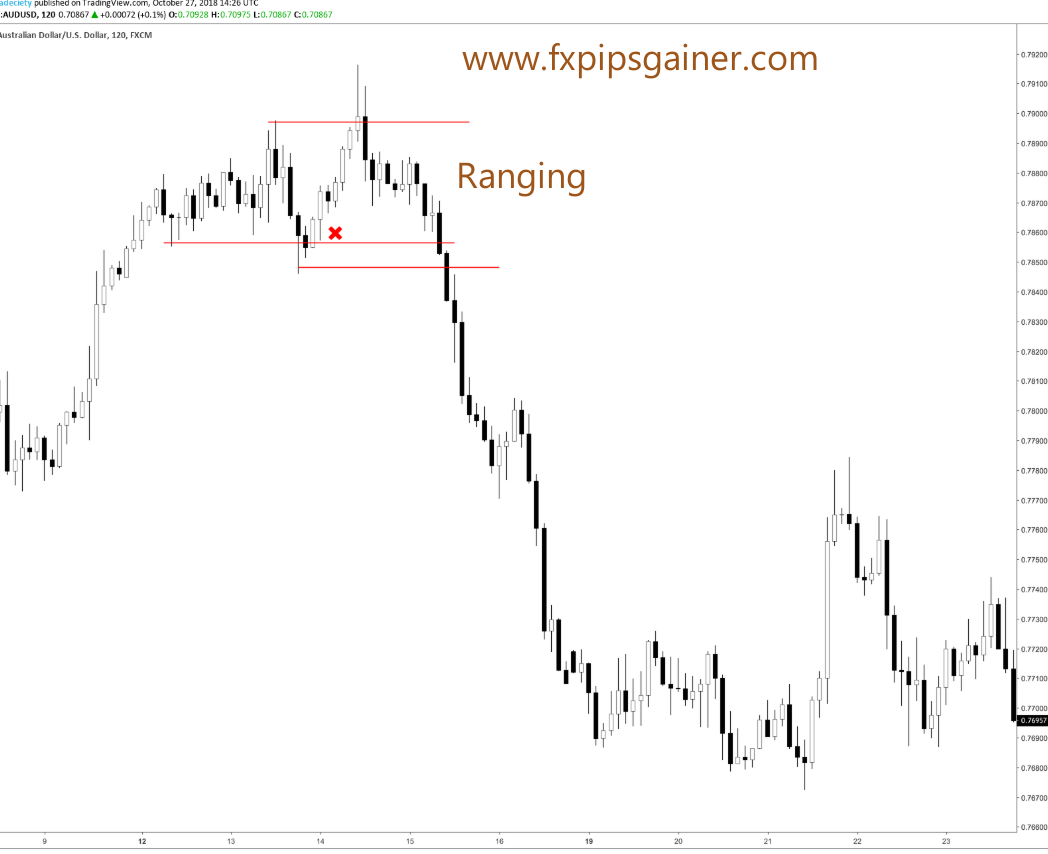
Watch out for false breakouts — quick moves outside the range that reverse back inside.
Always wait for a confirmed candle close outside the range before acting.
2. Flags
Flags occur within trends and look like small parallel channels sloping against the main direction.
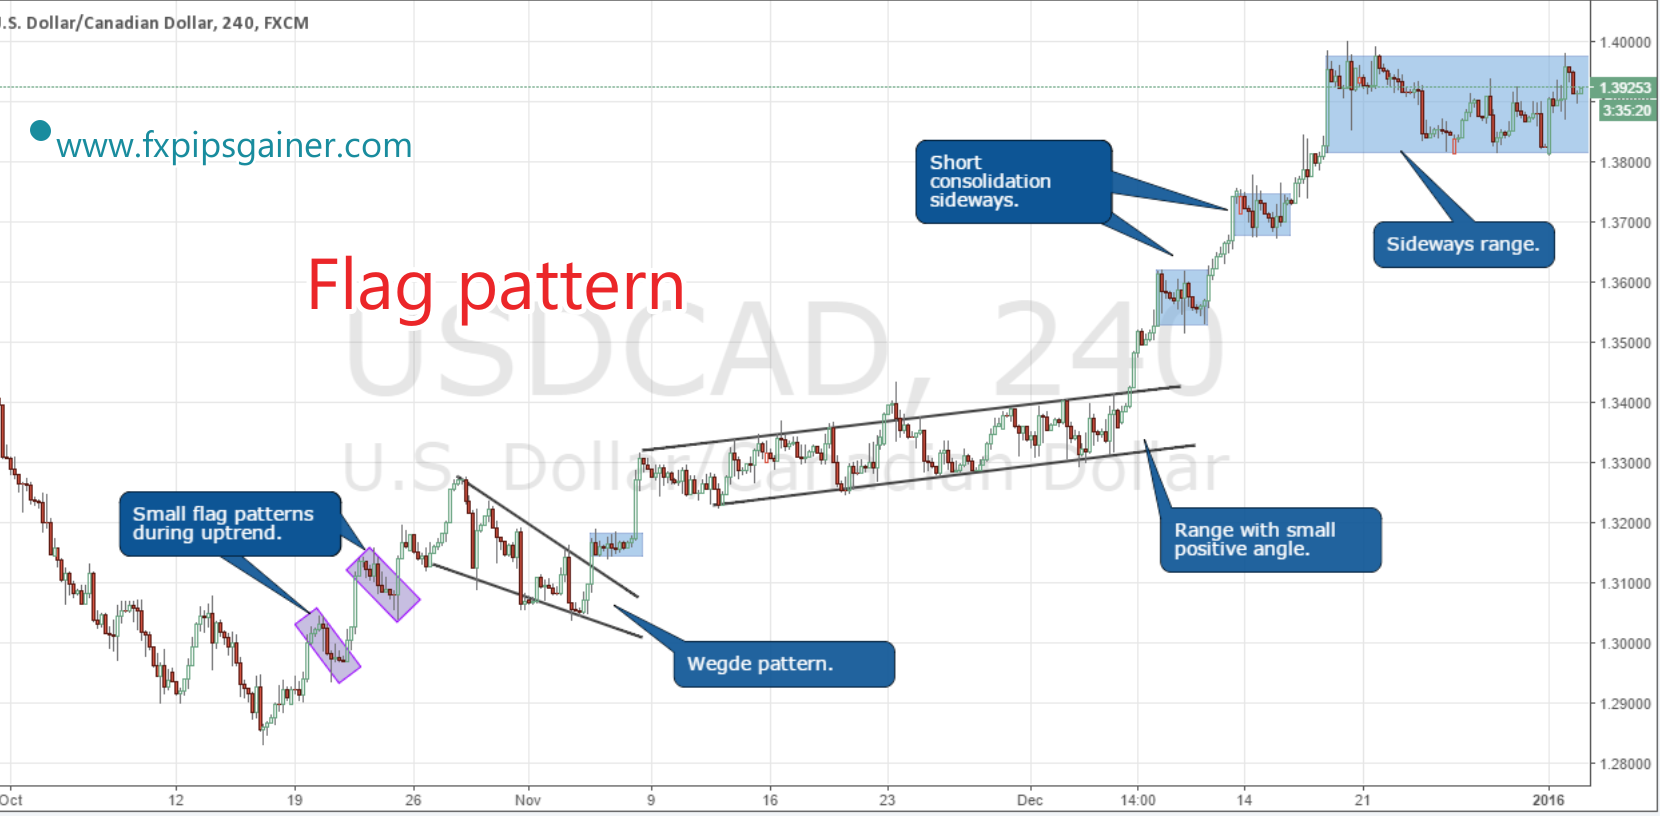
They represent temporary pauses before the trend continues.
A bullish flag forms during an uptrend, sloping slightly downward; a bearish flag during a downtrend, sloping upward.
The breakout usually happens in the direction of the prior trend.
3. Pennants and Triangles
These are tightening consolidation patterns where the highs and lows converge.
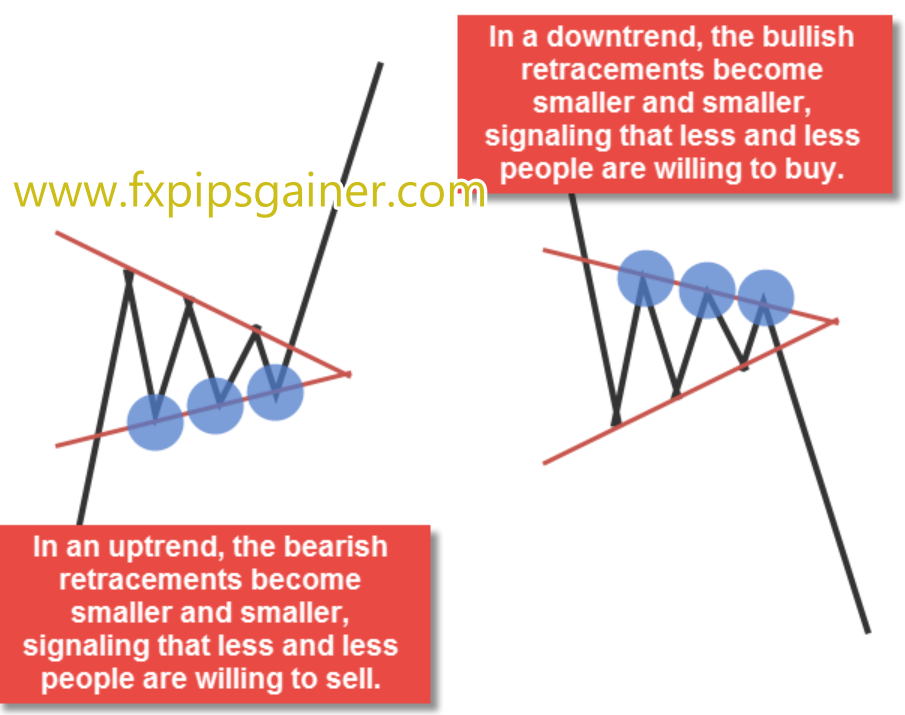
Symmetrical triangles: both trendlines converge equally — breakout can go either way.
Ascending triangles: higher lows with flat resistance — often bullish.
Descending triangles: lower highs with flat support — often bearish.
Wedges: similar to triangles but with steeper slopes, often signaling trend reversals.
How to Identify Consolidation Zones
Early identification gives traders an advantage. Here are reliable signs that a market is consolidating:
Flat or narrowing Bollinger Bands → volatility is decreasing.
ADX below 20 → trend strength is weak or absent.
Smoother moving averages → price oscillates sideways.
Declining volume → low participation; market waiting for a catalyst.
RSI near 50 → no momentum bias.
Lower highs and higher lows → compression before breakout.
Candles staying within the previous candle’s range → indecision.
Combine these signals for higher accuracy instead of relying on one indicator.
How to Trade Consolidations
There are two main approaches: Breakout Trading and Mean Reversion. The choice depends on your personality and market conditions.
1. Breakout Trading: Catching the Move
This is the most popular method — trading when price breaks out of the consolidation zone.
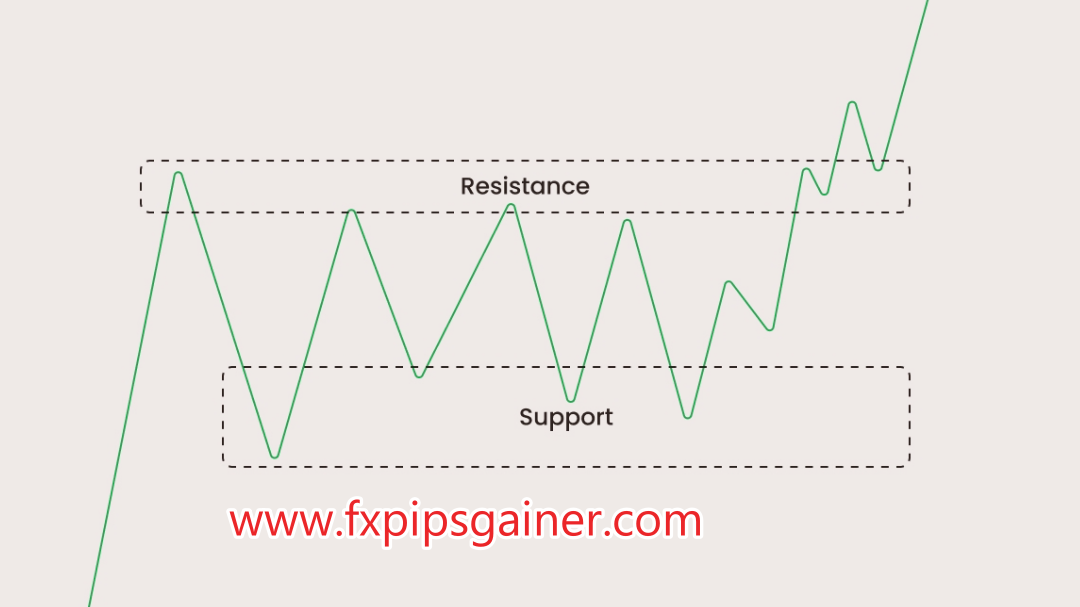
Steps to Trade a Breakout:
Identify the consolidation zone.
Draw clear horizontal lines connecting repeated highs and lows.Wait for a real breakout.
A breakout is valid only when a full candle closes above resistance (for buy) or below support (for sell).Confirm with volume.
Volume should increase during the breakout. A move with low volume is likely to fail.Check fundamentals.
News or economic data often triggers true breakouts. Watch calendars for high-impact events.Entry:
Enter after a candle closes outside the range. Avoid chasing the price mid-candle.Stop-Loss:
Place your SL inside the old range (below the last low for buy, above the last high for sell).Take-Profit:
Aim for 1.5:1 or 2:1 R:R. Adjust based on nearby support/resistance. The next strong structure point is your target.Optional Retest Entry:
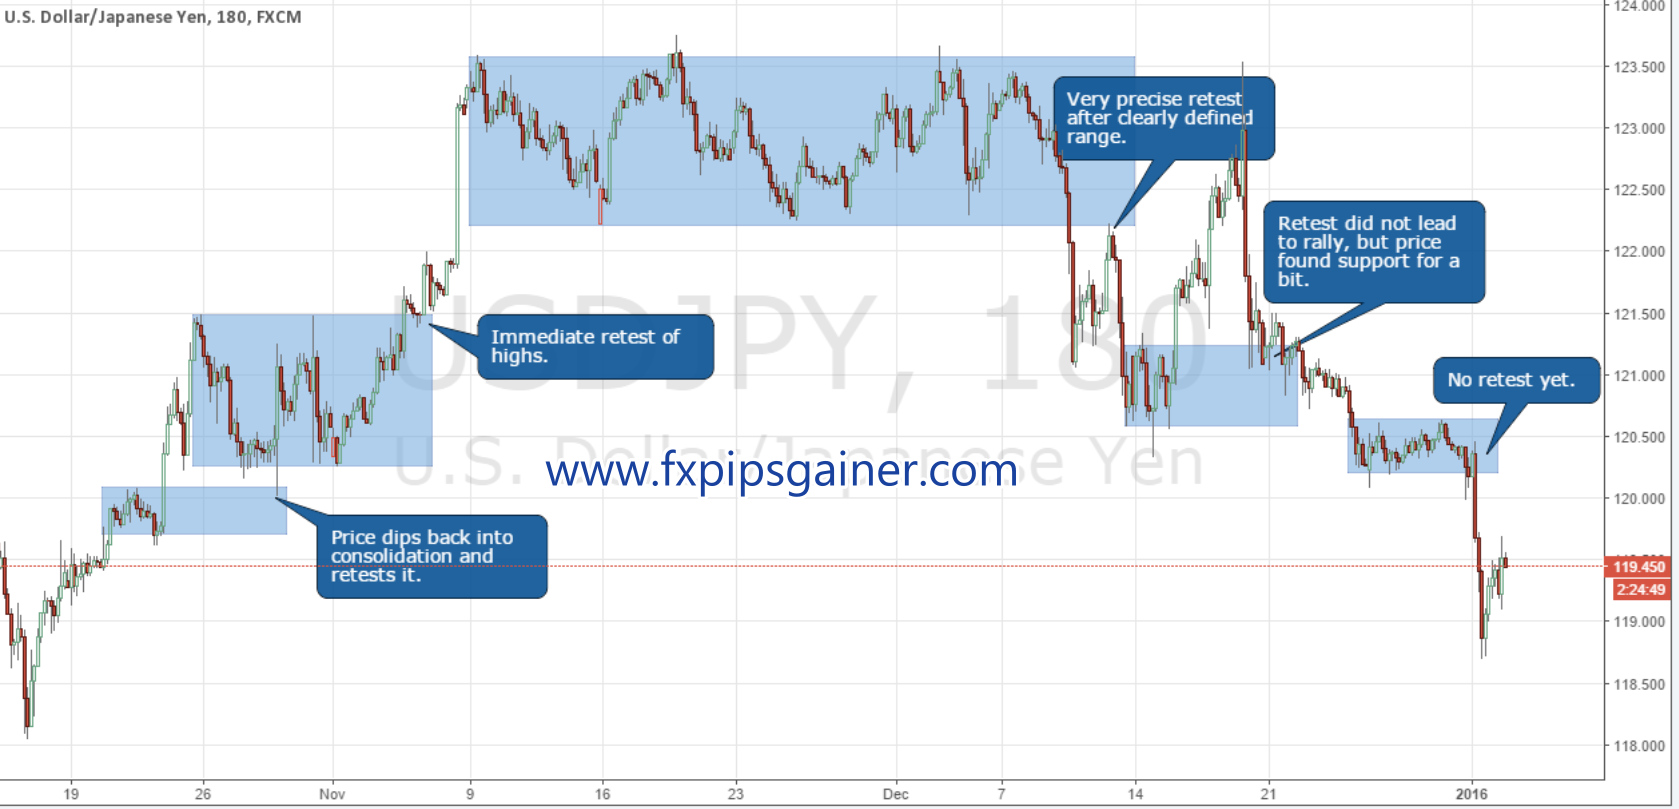
In Forex, price often retests the breakout level before continuing. This offers a second, safer entry opportunity.
2. Mean Reversion: Buy Low, Sell High
This strategy works best during quiet markets or low-volatility sessions.
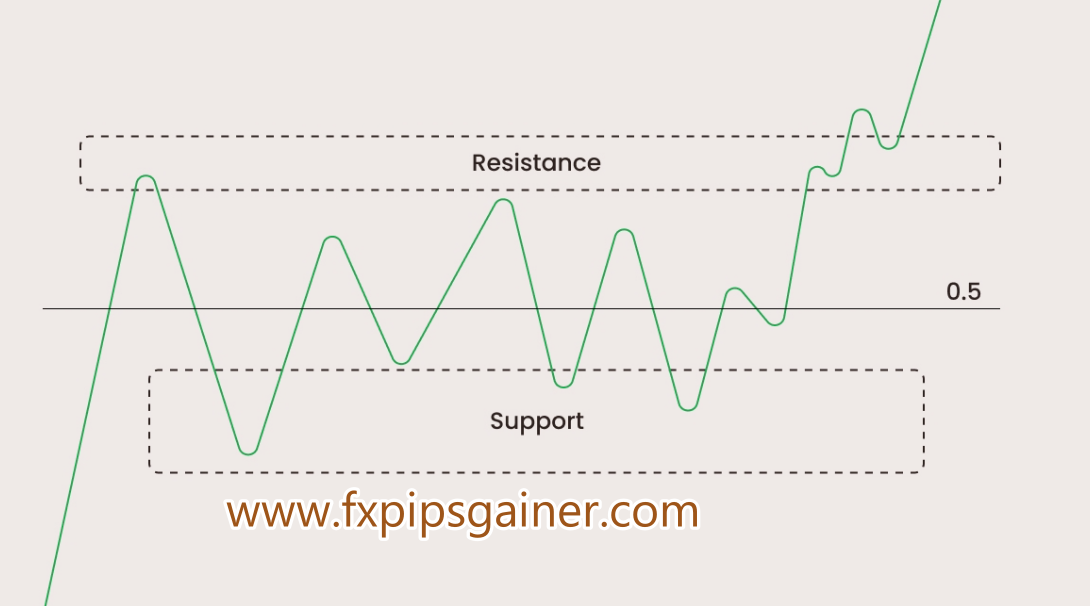
Identify a sideways range with multiple touches on both boundaries.
Buy near support, sell near resistance.
Look for reversal candles (Pin Bars, Engulfing, Tweezer patterns).
Confirm with RSI or divergence (RSI rising near support or falling near resistance).
Stop-Loss: Just outside the range boundary.
Take-Profit:
First target: middle of the range.
Second target: opposite end of the range.
Many traders close half at the midpoint and trail the rest.
This approach works well for pairs like EUR/CHF, AUD/NZD, or other slow-moving markets.
Three Key Factors for Better Consolidation Trading
Volume Analysis
Watch for an increase in volume near the range edges — it hints at institutional activity. Low volume breakouts often fail.
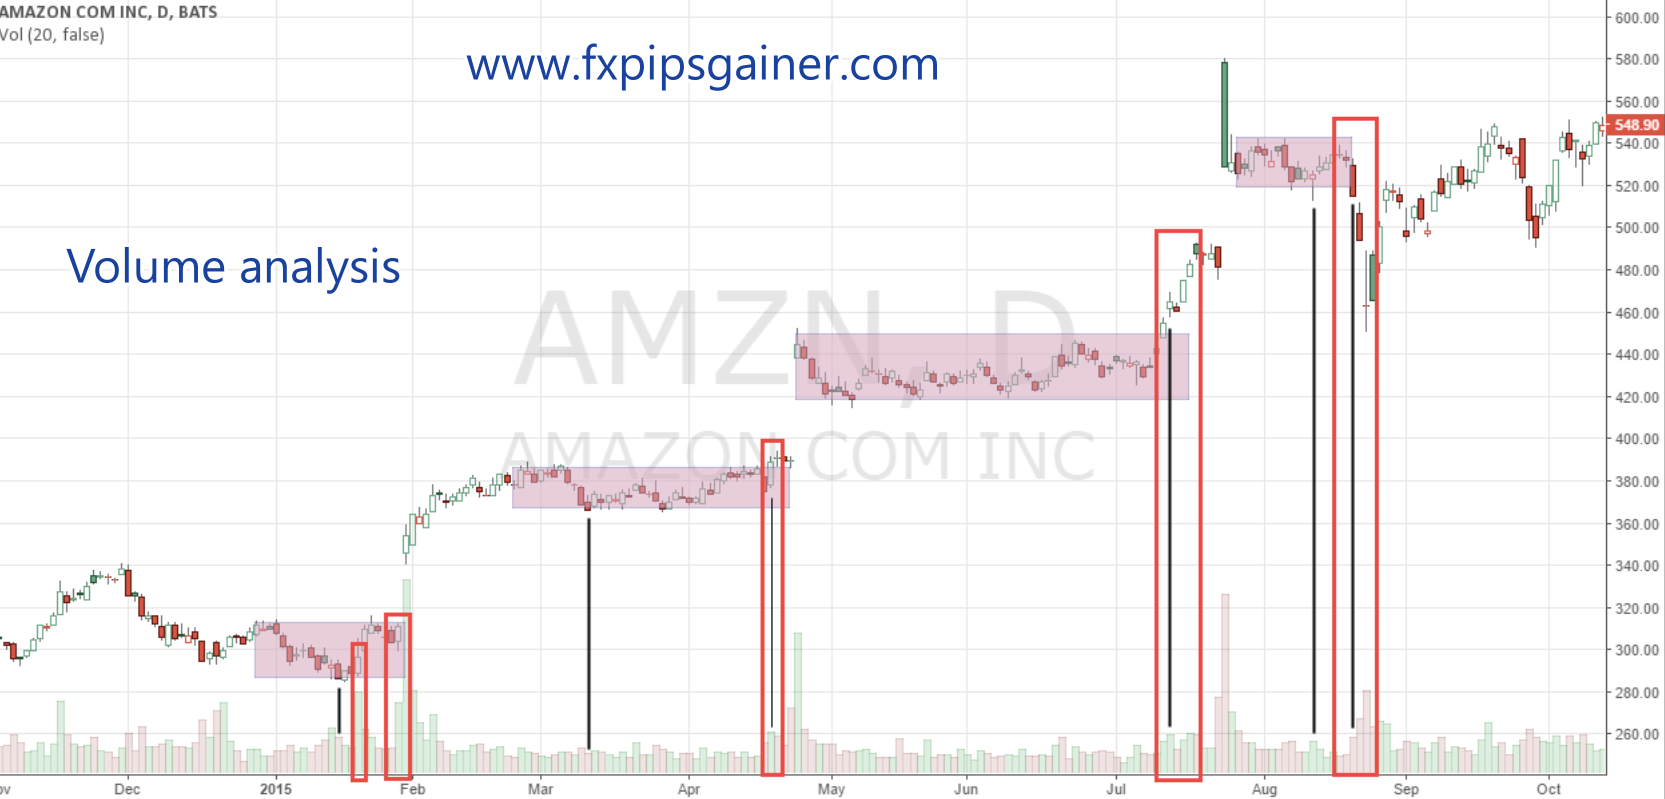
Length and Tightness of the Range
The longer and narrower the consolidation, the stronger the potential breakout. However, longer ranges may attract more false breakouts — always wait for confirmation.
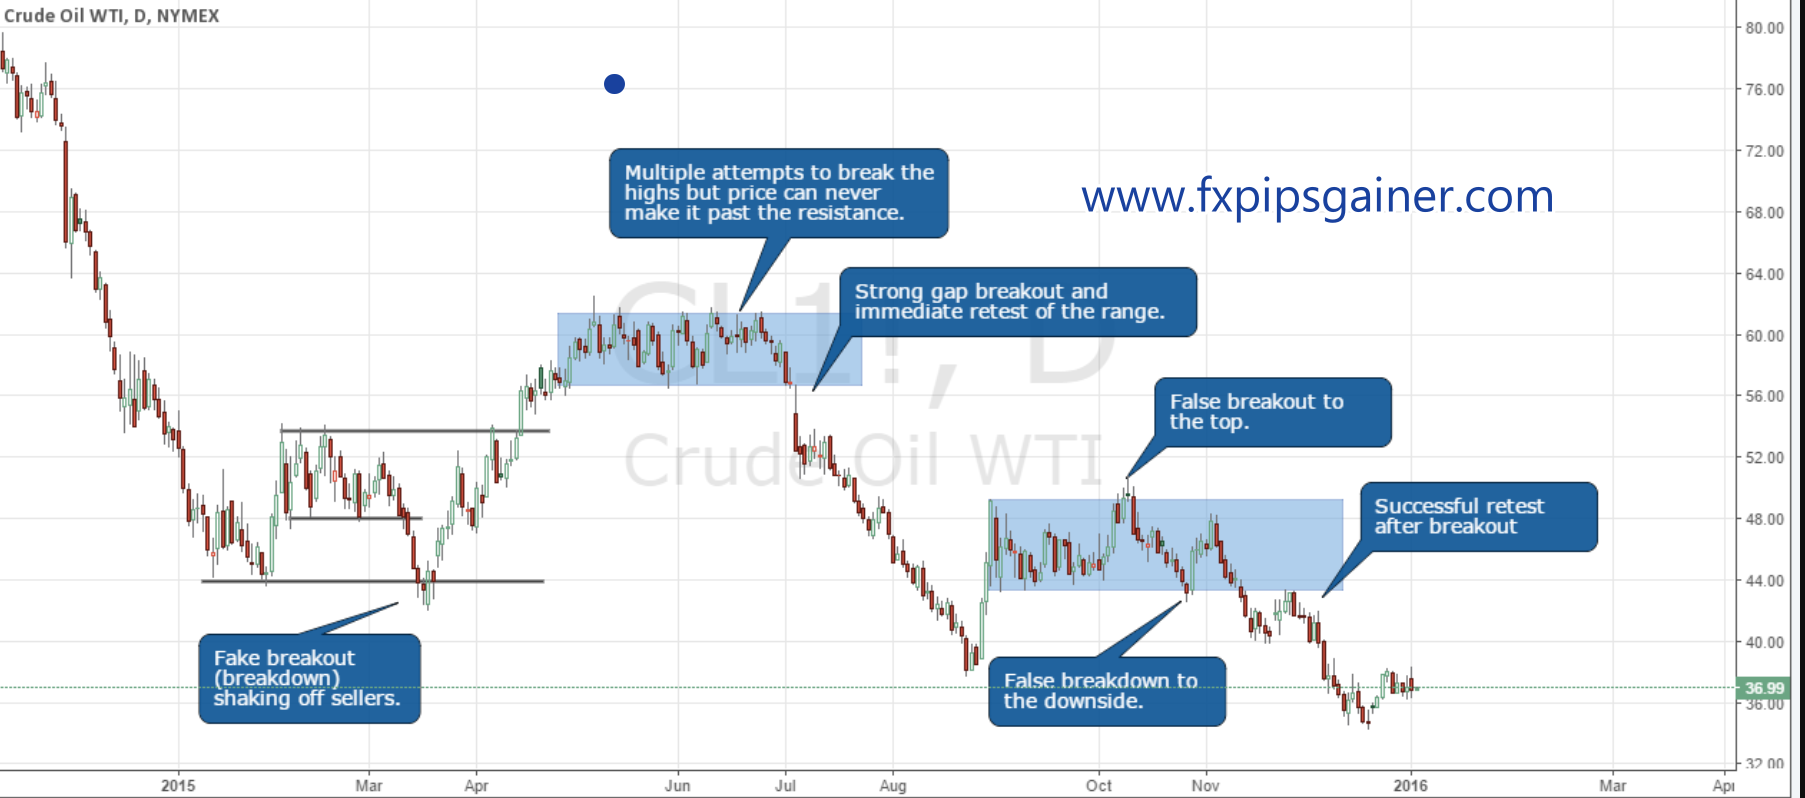
Retest Confirmation
Especially in Forex, price often revisits the breakout level before continuing. Waiting for this retest can reduce false entries.
Common Mistakes Traders Make
Entering too early without confirmation
Overtrading — taking every touch of the range
Ignoring volume and structure quality
Trading in messy, uneven zones
Not using a stop-loss
Expecting unrealistic profit targets
Risk Management Tips
Trade with smaller position sizes inside consolidations.
Wait for candle closes — don’t anticipate.
Focus on clean structures with clear boundaries.
Keep a reasonable R:R — even 1.2:1 or 1.5:1 can work if accuracy is high.
Limit to 2–3 attempts per range — don’t chase every move.
Conclusion
Consolidation trading is a powerful tool for patient traders. These phases represent the market’s breathing space — where smart money positions itself before the next big move.
By learning to recognize ranges, flags, and triangles, confirming with volume and structure, and managing risk carefully, you can turn “boring” sideways markets into consistent profit opportunities.
In Forex, a pause is never just a rest — it’s the reloading phase before momentum returns. Learn to spot it, trade it with discipline, and let the market do the heavy lifting for you.
Recent Posts
- What is a Cent Account?
- Smart Money Concepts: Mastering Mitigation Blocks, Breaker Blocks & QML
- Understanding ICT Reclaimed Order Blocks: How Institutions Control Market Moves
- How to Trade Consolidations in Forex and Other Markets
- How to Identify Real Forex Traders vs Fake Screenshot Gurus
- The Gold Accumulation System – A Safe Buy-Only Strategy for Cent Accounts
- The Dark Side of Forex: How Screenshot Scammers Trap New Traders
- CHOCH vs MSS: The Exact Difference Every Smart Money Trader Must Know
- Gold Buy-and-Hold Strategy Using Cent Account and Compounding Lot Size (No SL Trading Model)
- How to Trade Order Flow Imbalances: Simple Rules for Spotting Buy & Sell Order Blocks
- Copy Our Long-Term Gold Trading Strategy
- Execution Mode vs Outcome Mode — The Professional Approach to Managing Trades
- How I Achieved 80.95% Profit in One Year on HFM Copy Trading
- Why It Took Me 15 Years to Become a Profitable Trader
- How to Read and Interpret Profit Factor in Forex Backtesting
- Understanding the Institutional Accumulation Channel
- Understanding No-Deposit Bonuses in Forex: What You Need to Know
- XAUUSD Analysis Summary
- Gold Price Surge Summary
- XAU/USD(GOLD) Analysis 07/10/2025
- Gold Market Update 07/10/2025
- Gold(XAUUSD) Market analysis 07/10/2025
- Start your journey to Forex success
- আপনার ফরেক্স সফলতার যাত্রা শুরু করুন
- 7 Money Rules for Financial Awareness and Peace of Mind
- Gold Recovers Ahead of Nonfarm Payrolls: Key Insights
- Weekly Market Wrap: Gold Pulls Back Amid Dollar and Bond Rotation
- Copy Our Trade with OneRoyal
- Finding Your Path: How to Choose the Perfect Forex Mentor for Success
- Experience the Stability of a 100% Secure Trading Account!
- The 100% Profitable Trading Approach: Maximize Gains with Minimal Risk
- The Head and Shoulders Chart Pattern
- Bullish and Bearish Rejection Blocks: Identifying Key Trading Opportunities
- Just Market: Is It Worth Your Time and Money?
- Why LiteFinance Stands Out: A Comprehensive Review
- Understanding XAUUSD: Gold Strategy and Central Bank Reserve Management
- Hotforex Copy Trading Service
- Understanding Profit Factor: A Key Metric for Trading Success
- Supply and Demand Dynamics: How Gold Production Affects XAUUSD
- The Safe Haven: Gold as a Strategic Investment During Economic Downturns
- Mastering Deception: How to Scam as a Forex Signal Provider
- The Impact of Rising Bond Yields on Gold (XAUUSD)
- Understanding the Correlation Between Oil Prices and Gold (XAUUSD)
- The Impact of Geopolitical Events on Gold Demand (XAUUSD)
- Fundamental Strategy Overview: XAUUSD (Gold)
- Understanding the Role of Gold (XAUUSD) as an Inflation Hedge
- How Central Bank Interest Rates Influence Gold Demand
- Gold Holding Trading System
- From Novice to Pro: Navigating the ICT Propulsion Block in Trading
- Single Candle Order Block


