Maximize your profit by copy Our Trade
Supply Demand Indicator
What is a Supply Demand Indicator?
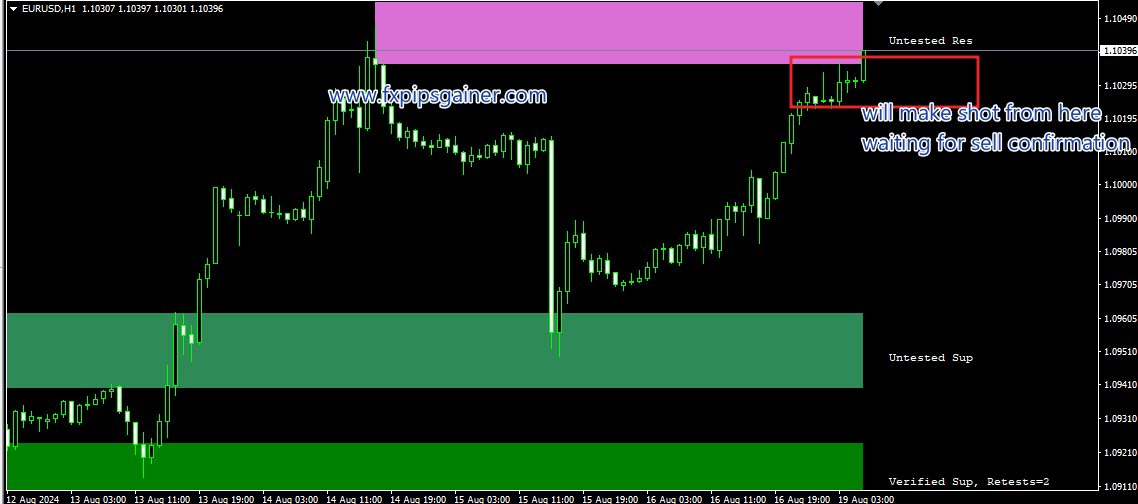
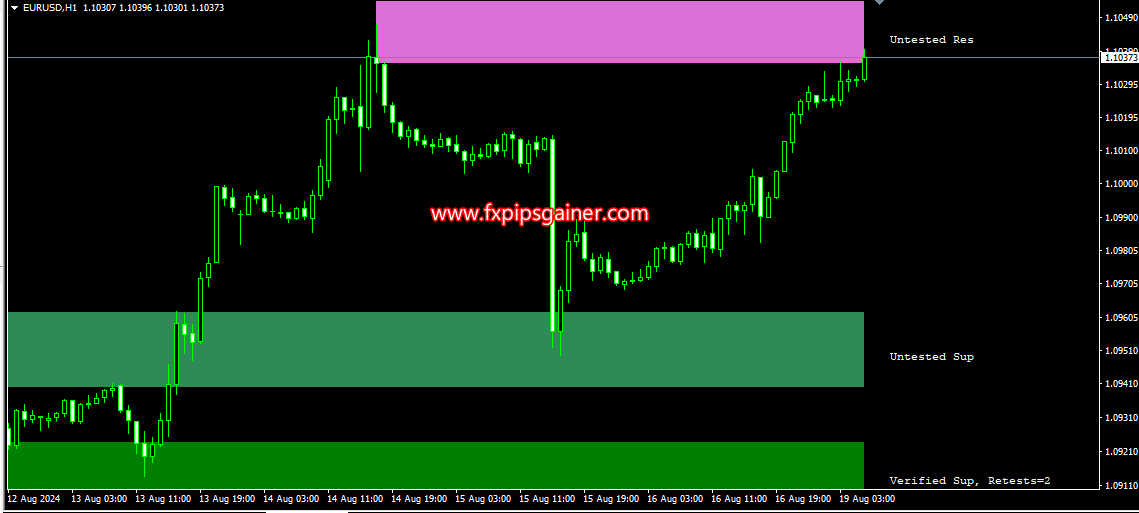
A Supply Demand Indicator is a trading tool used in financial markets to identify zones where price reversals are likely to occur due to an imbalance of supply and demand. It helps traders find potential entry and exit points based on the levels where buyers and sellers are active.
How It Works
- Identifying Zones: The indicator helps identify key supply and demand zones on a price chart.
- Price Action: It looks at historical price movements to determine where price previously reversed.
- Imbalance: When demand outstrips supply, prices rise; when supply outstrips demand, prices fall.
Characteristics of Supply Demand Indicator
- Zones: Visual representation of supply and demand areas on the chart.
- Reversal Potential: Highlights where price is likely to reverse.
- Timeframes: Effective across various timeframes.
- Volume Consideration: High trading volume often accompanies successful zones.
- Contextual Qualifiers: Market context can influence zone effectiveness.
Difference Between Supply Demand and Support Resistance Indicators
- Supply Demand: Focuses on imbalances between buyer and seller activity; indicates potential price reversals based on historical activity.
- Support Resistance: Static levels where price historically struggled to break through; does not account for the intensity of buying or selling.
How to Trade with Supply Demand Indicator
- Identifying Zones: Use the indicator to spot demand and supply zones.
- Waiting for Confirmation: Look for price action confirming the strength of the zone.
- Setting Entries: Enter trades at or near the identified zones.
- Managing Risk: Use stop-loss orders just beyond the zones to manage risk.
- Target Setting: Set profit targets at the next supply or demand zone.
The Supply Demand Indicator is a valuable tool for traders seeking to understand market dynamics better and make informed decisions based on areas of buying and selling pressure.
Trade Example
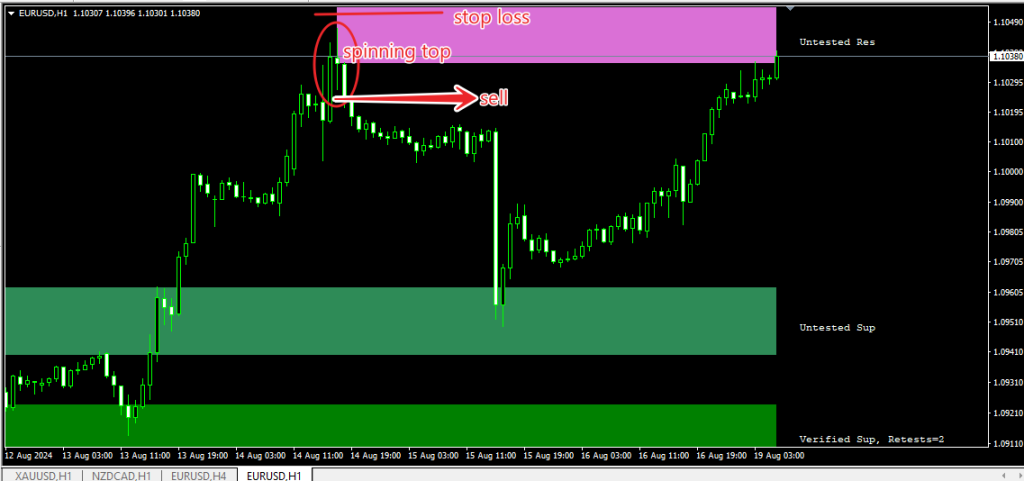
Scenario: Trading after an Uptrend with a Spinning Top
- Market Context:
Start in an uptrend, indicating bullish sentiment. Identify a supply zone where the price has previously reversed. - Identify the Candle Pattern:
Look for a Spinning Top candle at the supply zone. This pattern signals indecision among buyers and sellers, often indicating a potential reversal.
- Confirmation for Entry:
Wait for a breakdown below the low of the Spinning Top. This confirms that sellers are gaining control. - Executing a Short Entry:
Place a short entry order just below the breakdown point. This is where the price has shown that it may continue to move downwards. - Setting Stop-Loss:
Set a stop-loss above the high of the Spinning Top candle to manage risk. This way, if the price continues to rise, your losses are limited. - Target Setting:
Determine your profit target based on the next demand zone or a multiple of your risk (e.g., 1.5 times the risk taken).
Summary
This strategy utilizes the Supply Demand Indicator alongside candlestick patterns to capitalize on potential market reversals. By carefully managing risk and setting clear targets, traders can effectively navigate price movements.


