
Understanding the Institutional Accumulation Channel
When you look at the accumulation channel in the chart, it clearly shows where institutions were building their buy positions — this is known as the accumulation phase. Below is a simple, web-ready explanation you can paste into a webpage.
1. What Happens Inside the Channel
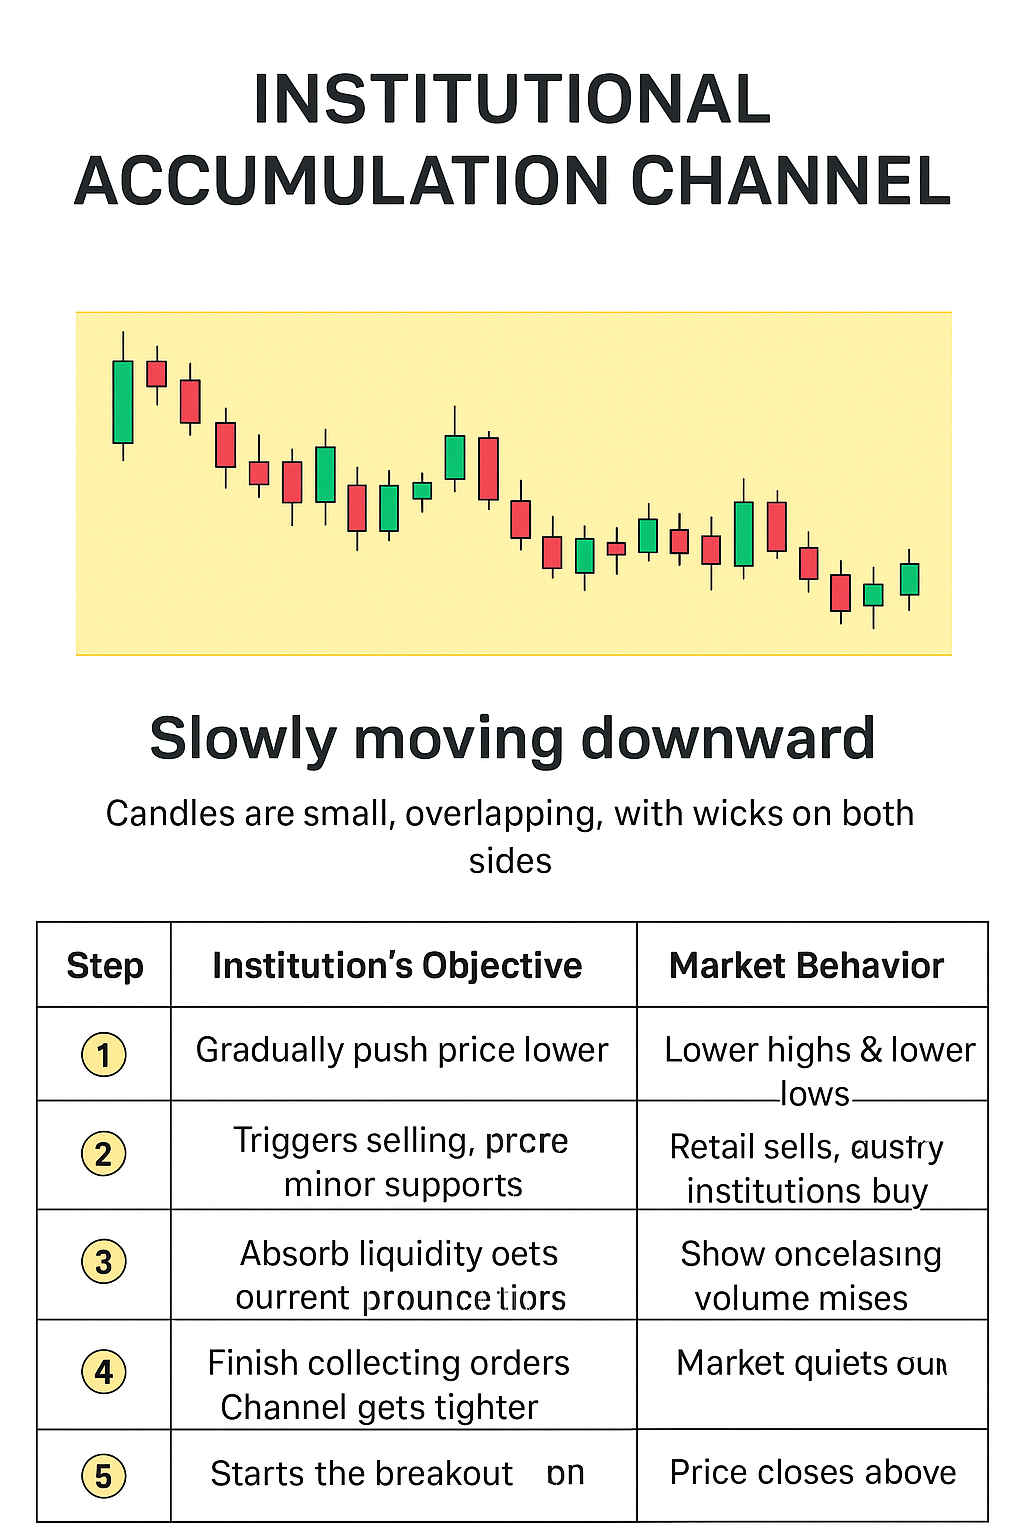
During this period, price moves slowly downward, but not aggressively. Candles are small, overlapping, and have wicks on both sides. This tells us the market isn’t truly selling — it’s preparing for buying.
Institutional traders don’t place huge buy orders all at once. Instead, they:
- Push the price slightly lower to trigger retail stop losses and induce fear.
- Buy the sell orders retail traders create during this panic — this is called liquidity collection.
2. The Auction Process Inside the Channel
Think of this entire phase as a market auction. Institutions are negotiating for liquidity while keeping the price within a range.
| Step | Institution’s Objective | Market Behavior | Retail Reaction |
|---|---|---|---|
| 1 | Gradually push price lower | Lower highs & lower lows | Retail thinks “a downtrend is starting” |
| 2 | Trigger selling | Price breaks minor supports | Retail sells, institutions buy |
| 3 | Absorb liquidity | Wicky, overlapping candles; volume rises but price stalls | Confusion — market seems “stuck” |
| 4 | Finish collecting orders | Channel gets tighter, fewer sellers | Market quiets down |
| 5 | Start the breakout | Price closes above the channel | Institutions begin marking price up |
3. When the Auction Ends
The auction ends when sellers are exhausted and institutions are fully loaded with buy orders. They then lift the offers — meaning they start driving the price up sharply.
- Retail shorts get stopped out
- Early buyers gain confirmation
- Institutions move into profit
4. Signs of Institutional Accumulation
Inside the channel, watch for these signs:
- Smaller candles
- Long lower wicks (showing rejection)
- Repeated bounces from the same support zone
- Flattening EMAs
These are all signs of accumulation or absorption — where big players are quietly buying.
5. Summary
The yellow channel (on the chart) is the institutional auction floor — a quiet accumulation zone where smart money loads up on long positions. They push price down first to buy cheap, then re-price it upward once their inventory is full. That’s the real story behind the accumulation channel — a silent battle for liquidity before the next major bullish move.
Institutional Accumulation — Visual Charts
Two simple, explanatory charts to illustrate the accumulation (auction) process inside a channel and the subsequent breakout.
Breakout ↑
Explosive bullish breakout after accumulation
Institutions collect liquidity → channel tightens → breakout