Maximize your profit by copy our trade
On concerns about global growth, the US dollar started to rally again this week.
Sterling withstood a test of support levels, but will GBP/USD continue to hold up? Investors are moving into Treasuries and Gilts as a result of increased scrutiny of China’s economy.
Despite Treasury yields falling coming into Wednesday’s session, the US Dollar surged because it appears that markets are looking for safe havens in a world where global growth is uncertain.
The return on the 10-year Treasury note fell below 4.0% due to the demand for US government debt before rising back above it, albeit it is still down from the 4.20% observed last Friday.
China’s trade surplus exceeded expectations in terms of money yesterday. To the end of July, however, the amount of imports and exports both fell sharply, by -12.4% and -14.5%, respectively, year over year.
Evidence of decreased economic activity in the second-largest economy in the world added to worries raised by Moody’s Monday rating of several US small banks.
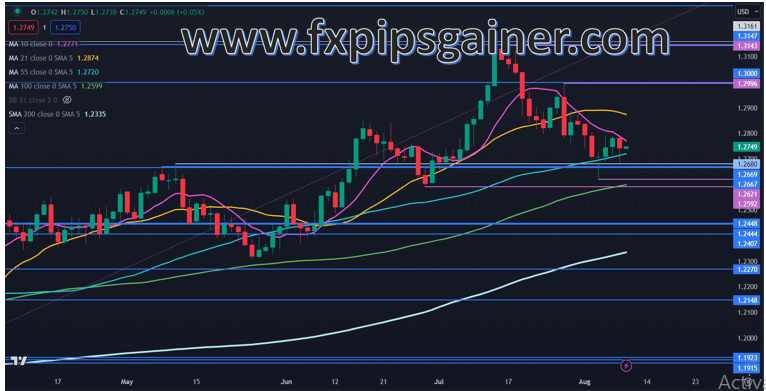
Sterling attempted to break lower in the scramble to purchase US Dollars but was stopped by a bid near some support at 1.2680.
The 10-year note’s inversion relative to the 2-year note is a characteristic of both the Treasury and Gilts markets. In comparison to the UK, the US is currently trading at close to -75 basis points (bp).
When bond markets demand less yield at the back end of the curve, it suggests that challenging economic conditions may arise at some point in the future.
However, despite their recent decline in August following a strong rise through July, equities markets are still within striking distance of record highs.
The US Dollar may benefit more in terms of currencies if perceived dangers to global output continue to rise. GBP/USD may then attempt to test the support levels once more as a result.
GBP/USD TECHNICAL ANALYSIS SNAPSHOT
GBP/USD made a low at 1.2685 yesterday, which was just above the historical breakpoints in the 1.2670 – 1.2680 area and those levels may continue to provide support.
Below there, the recent lows near 1.2620 and 1.2590 might provide support. The latter currently coincides with the 100-day simple moving averages (SMA) that could add impetus.
Looking at the SMAs, the price is above the 55-, 100- and 200-day SMAs that all have positive gradients, while it is below the 10- and 21-day SMAs that have negative slopes.
This might suggest that near-term bearish momentum is unfolding but that medium and long-term bullish momentum remains intact for now.
On the topside, resistance could be near the recent peak at the psychological level of 1.3000, which concurs with a historical breakpoint.
Further up, the 16-month high of 1.3142 is also just below some breakpoints in the 1.3150 – 1.3160 area and may offer a resistance zone.
Overall, GBP/USD appears to be caught in a wide range.
