Maximize your profit by copy Our Trade
What is Breakout Trading?

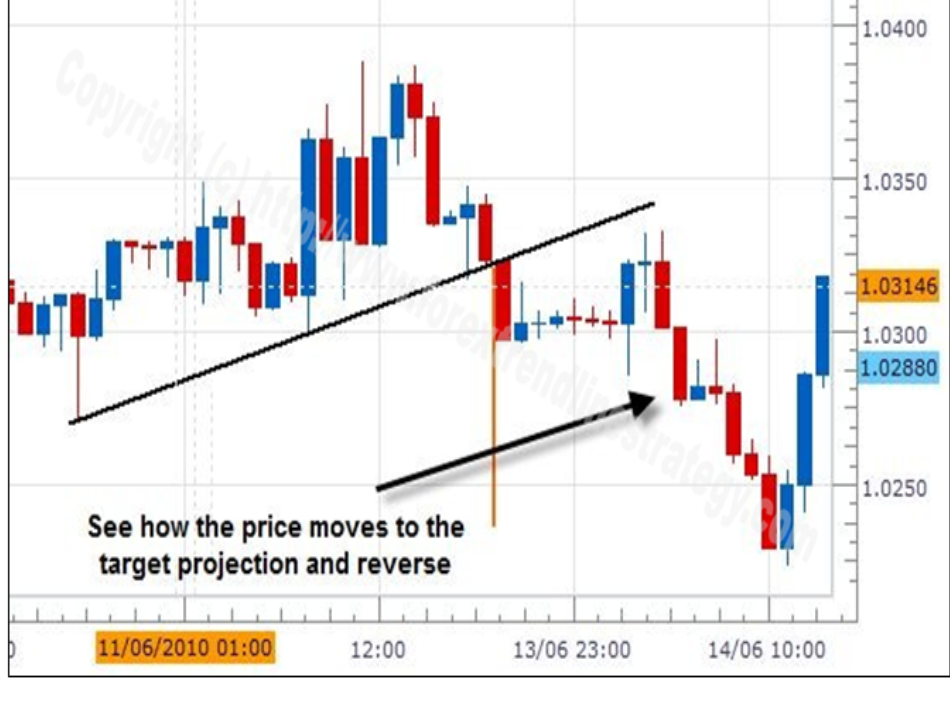
Breakout trading involves entering a trade when the price of a currency pair moves beyond a defined support or resistance level. Such breakouts often lead to increased volatility and significant price movements, allowing traders to capitalize on rapid changes in the market.
Key Concepts
Support and Resistance Levels
Support Level: A price level where buying interest is strong enough to overcome selling pressure, preventing the price from falling further.
Resistance Level: A price level where selling interest is strong enough to overcome buying pressure, preventing the price from rising further.
Volatility
When the price breaks through support or resistance, it often leads to heightened market activity. Traders can profit from these rapid price movements if they correctly anticipate breakouts.
Identifying Breakout Points
Chart Analysis
To identify potential breakout points, traders can analyze charts to find support and resistance levels. Key techniques include:
- Historical Price Levels: Look for areas where the price has previously reversed or consolidated.
- Chart Patterns: Identify classic patterns that suggest a breakout, such as:
- Triangles
- Rectangles
- Head and Shoulders
- Double Tops and Bottoms
- Wedges
- Flags
Technical Indicators
Utilizing technical indicators can help confirm breakouts. Some popular indicators include:
- Bollinger Bands: These can indicate potential breakouts when the price moves outside the bands.
- Average True Range (ATR): Helps to measure market volatility and can confirm the strength of a breakout.
Example of a Breakout Trading Strategy
Scenario Setup
- Currency Pair: GBP/USD
- Chart Type: 1-Hour Chart
Indicators Used: Bollinger Bands, ATR
Step-by-Step Strategy
Step 1: Identify Support and Resistance Levels
Analyze the 1-hour chart for GBP/USD. Mark key support and resistance levels where the price has previously reversed, such as:
- Support at 1.3000
- Resistance at 1.3200
Step 2: Monitor Price Action
Watch for the price to approach these levels. Look for signs of consolidation (e.g., the price moving sideways) near the resistance or support level.
Step 3: Set Up Entry and Exit Points
Entry Point:
- For a bullish breakout, set a buy order just above the resistance level (e.g., 1.3210).
- For a bearish breakout, set a sell order just below the support level (e.g., 1.2990).
Stop-Loss Order:
- Place a stop-loss order below the breakout point for a bullish trade (e.g., 1.3190).
- For a bearish trade, place the stop-loss order above the breakout point (e.g., 1.3010).
Step 4: Confirm the Breakout
Utilize Bollinger Bands to confirm the breakout. A breakout is validated if the price moves outside the bands. Use the ATR to assess volatility; a higher ATR indicates stronger market movements.
Step 5: Execute the Trade
Enter the trade once the breakout confirmation occurs (e.g., price exceeds 1.3210). Monitor the trade closely and adjust the stop-loss as the price moves in your favor.
Step 6: Set Take-Profit Levels
Identify potential take-profit levels based on measured moves from the breakout point or nearby resistance levels. Set a take-profit order at a reasonable target, such as 1.3300 for a bullish trade.
Risk Management
- Stop-Loss Orders: Always use stop-loss orders to limit potential losses.
- Take-Profit Orders: Secure profits by setting take-profit levels based on your analysis.
- Position Sizing: Determine appropriate position sizes based on account size and risk tolerance.
Conclusion
Breakout trading can be a highly effective strategy when executed correctly. By identifying key support and resistance levels, utilizing technical analysis, and implementing strong risk management practices, traders can profit from significant market movements. Continuous learning and adaptation to market conditions are crucial for long-term success in breakout trading.


