| Summary |
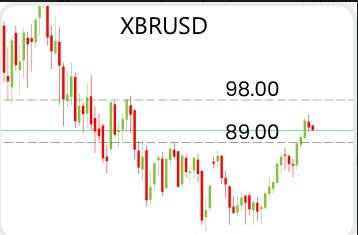
| Trend: Bullish |
| Support: 89.00 |
| Resistance: 98.00 |
Maximize your profit by copy our trade
1. Russia and Saudi Arabia agreed to extend their oil supply cuts until the end of 2023, exceeding expectations for a shorter duration.
2. The price of XBRUSD (Brent crude oil) broke out of its previous range of $70 to $89, which had persisted for over a year.
3. With the upward direction now open, the former resistance level at $89.00 is expected to act as solid support.
4. The major resistance level to watch is at $98.00, indicating a potential target for traders.
5. Traders may consider utilizing the trading range between $89.00 and $98.00 as a strategic opportunity in October.
| Summary |
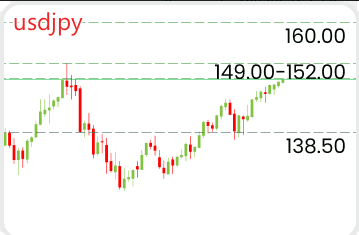
| Trend: Bullish |
| Resistances: 149.00, 152.00, 160.00 |
| Support: 138.50 |
1. October is expected to be a crucial month for the USDJPY currency pair due to several factors.
2. The US dollar may be strengthened by higher oil prices, which increase inflation risks.
3. The Bank of Japan has not indicated any potential changes in its monetary policy, which could impact the currency pair.
4. If there are no changes, sellers may struggle to overcome the resistance range of 149.00 to 152.00, potentially leading to a further upward move towards 162.00.
5. However, if the Bank of Japan tightens its monetary policy, a significant reversal could occur, potentially pushing the pair down towards 138.50.
Overall, USDJPY is expected to be an interesting instrument for trading in October due to these dynamics.
| Summary |
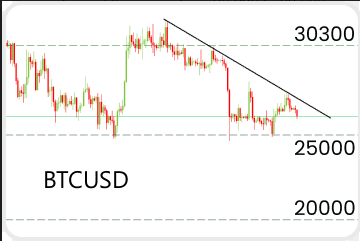
| Trend: Flat, sideways |
| Resistances: 27 700, 28 900, 30 300 |
| Support: 25 000, 20 000 |
1. Bitcoin (BTCUSD) has been facing downward pressure along with other risky assets, influenced by the strengthening US dollar.
2. Unclear regulations, issues with Binance, and the quantitative tightening policy have contributed to the struggle in the cryptocurrency market.
3. Positive developments and a weakening US dollar have the potential to push BTCUSD above the descending resistance trendline, indicating a potential upward move.
4. If buyers are unable to maintain support at the 25,000 level, there is a possibility of a significant decline in Bitcoin’s price, potentially reaching as low as 20,000.
5. The outcome for BTCUSD in the near term is uncertain, but these factors make it a volatile instrument to watch and trade.