


In the world of finance, economic indicator releases are highly-anticipated events that are closely watched by the professionals.
You should avoid trading during these periods (especially if you’re new), as they involve macroeconomic topics that most beginner traders are unfamiliar with.
You can get the schedule of the economic news releases at this website:
www.forexfactory.com/calendar.php
Before taking a trade, you are strongly advised to first check this website to ensure you are not entering the market ahead of a high-impact release.
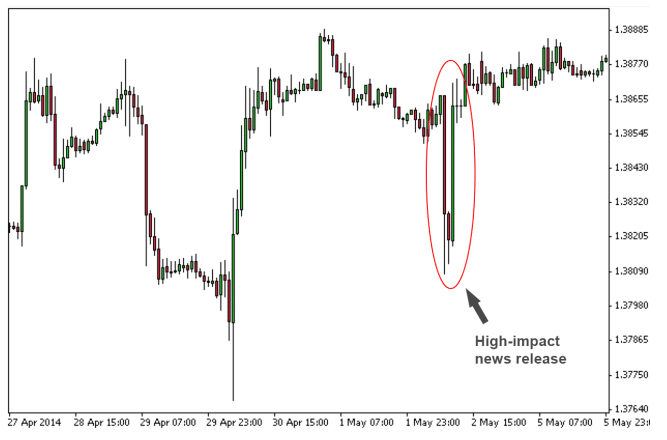
Here are a couple of examples that show how price momentum can be ineffective during these periods:
Most of the time, the market price moves with relatively weak momentum.
And as you’ve learned in the previous section, weak momentum is indicated by a candlestick with a small real body, and/or long shadows.
But what does weak momentum mean?
For the most part, it indicates market indecision.
This means that there is no consensus amongst the buyers and sellers, so the market price remains more or less stagnant.
And as you might have guessed, this is not a good time to enter a trade, especially after prices have remained stagnant for some time.
A common type of candlestick you’ll see during periods of extreme indecision is the Doji:
The Doji looks like a cross because the opening price is the same (or very near to) the closing price. Therefore, this candlestick has effectively no real body.
Many trading books and websites claim that a Doji candlestick indicates a change of market direction, and that you should enter a trade in the opposite direction of the prior trend.
But now that you know that a Doji candle merely indicates indecision, do you agree with this saying?
… Not necessarily, right?
Well think about this:
Should you enter a trade when the buyers (or sellers) are pushing prices in one direction (i.e. with momentum)?
Or when the buyers (or sellers) are unable to push prices in either direction
(i.e. with indecision)?
When you learn the facts and start thinking for yourself, you’ll find that much of the information published on the internet is dead wrong!
As you might have realised, this book is not about telling you what to do… it’s about teaching you to think for yourself.
The concepts we’ll cover here are the mental tools and frameworks you’ll need to make your own decisions. In my opinion, this is the only effective way to learn to about trading.
Now if you’re ready to move on to the next section, let’s continue.
OK, so we know that a candlestick with long shadows indicates market indecision…
… but what if only one of the shadows is long, like this?
When we see a candlestick with only one long shadow, it means that one side of the market (i.e. buyers or sellers) tried to push prices in their direction, but the other side has pushed back.
In trader-speak, we say that one side of the market has been rejected.
Let’s see what this means…
A single long top shadow indicates that the buyers in the market tried to push prices up, but the sellers are strong enough to push prices back down again.
Since the buyers in the market were unable to keep prices at high levels, we say that a long top shadow represents buyer rejection.
Conversely, a long bottom shadow indicates that the sellers in the market tried to push prices down, but the buyers were strong enough to push prices up again.
Because the sellers in the market were unable to keep prices at low levels, we say that a long bottom shadow represents seller rejection.
When we see a rejection candle after prices have been trending (i.e. moving in one direction) for some time, it means that the trend is likely come to a halt.
In other words, a rejection candle indicates the likely exhaustion of a prior price trend.
In the chart below, notice how the rejection candles predicted the end of the prior price trend.
Unlike a candlestick with strong momentum (where one side of the market is already dominating the other), a rejection candle indicates a potential turning point where one side just begins to dominate the other.
Thus, rejection candles indicate a higher chance of prices moving in the opposite direction of the shadow.
Reverse Rejection
Reverse rejection refers to a situation where a rejection candle incorrectly predicts a turning point of a price trend.
The best way to understand how this works is with an example:
Here, we see the market moving down. The latest candle shows a long bottom shadow, indicating seller rejection. This may be a good time to enter a ‘buy’ trade.
But what happened next?
Three candles later, we see that prices have NOT continued to move up. This is unusual because prices typically reverse within 2-3 candles after a rejection candle.
When we don’t see a quick reversal after a rejection candle, it means that the rejection signal is likely to have failed.
In that case, prices are now likely to keep moving in the same direction as the prior trend (in this case, down).
It would thus be a good idea to close any ‘buy’ trades, and ‘sell’ instead.
Let’s see what happens…
Indeed, prices continued to fall and any ‘sell’ trades would now be in profit.
This is a simple, yet effective method of quickly cutting losses and getting on the right side of the market.
Be careful not to fall into the trap of thinking in terms of ‘most accurate’ and ‘least accurate’. I say this because trading with candlesticks is NOT about looking for a single high-probability signal.
Instead, we want to look out for multiple signals that all point to the same prediction of where prices are likely to go.
It’s about accessing the situation based on both confirming and conflicting signals, and then making a judgement call about where prices are most likely to move next. We’ll talk more about this in the later sections.
1. Strong price momentum indicates a higher probability of prices continuing to move in the same direction.
2. Weak price momentum indicates market indecision.
3. A rejection candle indicates a higher probability of prices moving in the opposite direction of the shadow.
4. Reverse rejection indicates a higher probability of prices continuing to move in the direction of the existing trend.
5. Successful trading involves multiple confirming signals, not a single “high probability” signal.
6. Avoid trading just before, and during the release of high-impact economic indicators.