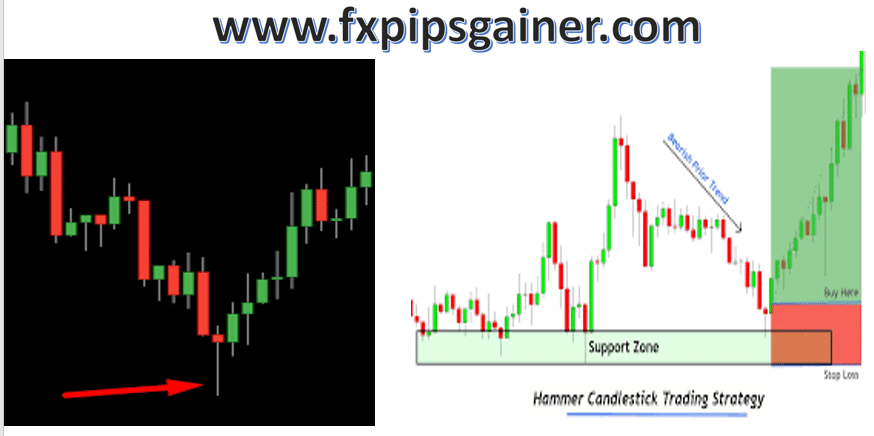
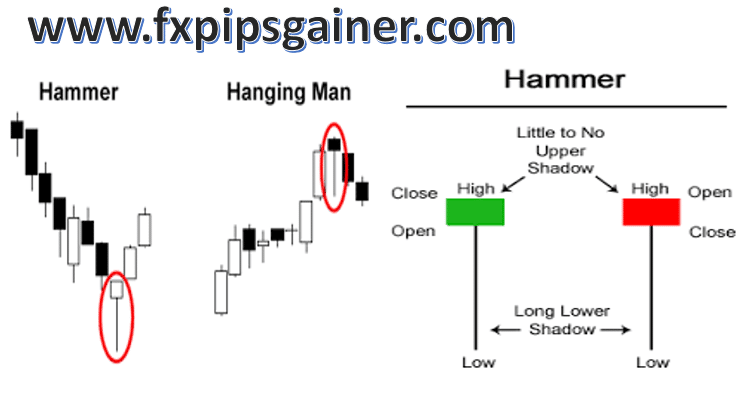
The hammer candlestick pattern is a popular candlestick pattern used in technical analysis to analyze price charts. It typically forms after a downward trend and is considered a bullish reversal pattern. The pattern is named “hammer” due to its resemblance to a hammer, with a small body located at the upper end of the candlestick and a long lower shadow or wick.
Maximize your profit by copy Our Trade

Here are the key characteristics of a hammer candlestick pattern:
1. Shape: The candlestick has a small body near the top of the range, representing the opening and closing prices.
2. Lower shadow: The candlestick has a long lower shadow or wick, which extends below the body of the candlestick. The length of the shadow should be at least twice the size of the body.
3. Upper shadow: The hammer candlestick has little to no upper shadow, or it can be very short compared to the lower shadow.

The hammer pattern suggests that sellers were initially in control of the market, driving prices lower. However, buyers entered the market and pushed prices back up, resulting in a small body near the top of the candlestick. The long lower shadow indicates that there was significant buying pressure during the trading session, with buyers successfully pushing prices well off the lows.
Traders and analysts interpret the hammer candlestick pattern as a potential reversal signal, indicating a shift from a bearish sentiment to a bullish one. However, it is essential to consider other factors and indicators to confirm the reversal before making trading decisions. The pattern’s effectiveness can vary, so it’s always recommended to use it in conjunction with other technical analysis tools and indicators for more reliable signals.
Here are some additional details about the hammer candlestick pattern:
1. Confirmation: While a hammer candlestick pattern may suggest a potential reversal, it is crucial to wait for confirmation before taking any trading actions. Traders often look for confirmation through subsequent price action, such as a higher close or bullish follow-through in the next candlestick or candlestick pattern.
2. Support levels: The hammer pattern is considered more significant when it forms near support levels, such as trendlines, moving averages, or previous price support zones. The presence of support adds to the potential bullish signal, indicating that buyers are stepping in at a key level.
3. Volume: Volume analysis can provide additional insights when interpreting a hammer candlestick. Ideally, traders would like to see higher-than-average volume during the formation of a hammer, indicating strong buying interest. Higher volume suggests that market participants are actively participating in the potential reversal, increasing the likelihood of a meaningful price move.
4. Variations: While the classic hammer pattern has a bullish bias, variations of the pattern can occur. For example, an inverted hammer has a long upper shadow and a small or nonexistent lower shadow, indicating potential bearish reversal characteristics. It suggests that sellers initially drove prices higher, but buyers later stepped in, pushing prices back down.
5. Timeframes: The interpretation of a hammer pattern can vary depending on the timeframe being analyzed. A hammer on a daily chart may indicate a potential reversal over the next few days, while a hammer on a weekly or monthly chart could suggest a shift in sentiment over a more extended period.
6. Stop-loss placement: When trading based on a hammer pattern, it is important to set appropriate stop-loss levels to manage risk. Traders often place stop-loss orders below the low of the hammer candlestick to protect against potential false signals or further downward price movement.
Remember that no single candlestick pattern can guarantee a successful trade. It is always recommended to combine candlestick analysis with other technical indicators, chart patterns, and fundamental analysis to make well-informed trading decisions. Additionally, practice and experience in analyzing candlestick patterns are vital for effective implementation.