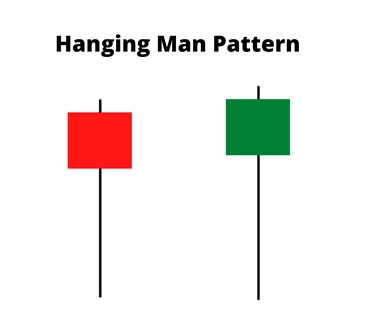
Here are the characteristics of the Hanging Man candlestick pattern, outlined point by point:

Maximize your profit by copy our trade
1. Formation at the end of an uptrend: The Hanging Man pattern typically occurs at the conclusion of an upward price trend, suggesting a potential reversal in the market.
2. Single candlestick: The pattern consists of a single candlestick on the price chart, making it easy to identify and analyze.
3. Bearish reversal signal: The Hanging Man pattern serves as a bearish reversal signal, indicating a shift from bullish sentiment to bearish sentiment in the market.
4. Small real body: The real body of the Hanging Man candlestick is relatively small, emphasizing the balance and struggle between buyers and sellers.
5. Positioned at the top: The small real body is located at the top of the candlestick, representing the opening and closing prices of the trading session.
6. Long lower shadow: The Hanging Man pattern is characterized by a long lower shadow (also known as the lower wick), which should be at least twice the size of the real body. It represents the intraday low reached during the session.
7. Little or no upper shadow: The Hanging Man typically lacks an upper shadow, or if present, it is relatively small compared to the lower shadow.
8. Psychological interpretation: The pattern’s formation reflects an initial attempt by buyers to push prices higher, but their efforts are ultimately thwarted by sellers, resulting in a reversal of the uptrend.
9. Signifies seller dominance: The Hanging Man formation suggests that sellers have regained control in the market, potentially leading to further price declines.
10. Confirmation candle: Traders often look for a confirming bearish candlestick formation on the following trading day to validate the Hanging Man pattern and strengthen the bearish signal.
11. Trading strategy: Traders may choose to enter a short position after the Hanging Man pattern forms, provided the subsequent candle confirms the bearish sentiment. Stop-loss orders can be placed slightly above the high of the Hanging Man candle to manage risk.
12. Limitations and false signals: Like any technical pattern, the Hanging Man is not foolproof and can produce false signals. Traders should exercise caution, employ risk management techniques, and consider additional analysis tools for confirmation.
Understanding the characteristics of the Hanging Man pattern is essential for traders seeking to incorporate it into their analysis. By recognizing these key points, traders can make more informed decisions and potentially capitalize on bearish reversals in the market.
How to Trade with Hanging Man Candlesticks Pattern
Step 1
The pattern’s main prerequisite is that it must emerge following a bullish trend. The price of cryptocurrencies fluctuates by forming bullish and negative swings. Traders can identify a bullish trend by observing several higher highs in the price.
The figure above illustrates an example of an uptrend. Through the creation of new highs, the price is rising. The price has a few negative candles, but overall, the pressure is still positive. A bullish trend, like this one, is the main sign of a Hanging Man pattern since it increases the likelihood that a corrective force will drive the market lower.
Step 2
Next, at the apex of a bullish trend, spot the Hanging Man pattern. Though not required, a bullish gap at the opening of this candlestick is a sign that sellers should take advantage of. Keep in mind that the wick of a legitimate or complete pattern needs to be at least twice as long as the body of the design. Furthermore, any Hanging Man design that originates from a noteworthy resistance level is similarly legitimate.
Step 3
Traders should hold off on opening a sell trade until they see a bearish candle following the development of the Hanging Man pattern. The bearish daily candle after the pattern forms suggests that sellers are more likely to start a downtrend.
Opening a sell-stop order below the candle’s low is the most aggressive way to trade this pattern. Traders typically position the stop loss above the candlestick pattern, along with an additional buffer to protect against false breakouts. The take profit will also depend on the strength of the trend and the proximity of support levels.
Step 4
Trading cryptocurrencies successfully depends on your ability to manage trades. Any unexpected action creates uncertainty in the global financial market. You could lose money even when you’re trading a Hanging Man pattern from a swing high with a suitable sell entry.
Example of Hanging Man in a GBPNZD Chart


