


Maximize your profit by copy Our Trade
Supply and Demand zones do offer a great insight into the structure of any market. If you have an idea of how to trade with support and resistance zones, you might find supply and demand zones very similar. You won’t be mistaken.
Supply and demand zones are very similar if not the same. There are certain rules though that make them stand aside and IMHO shine brighter than just support and resistance. I will make sure you will find out exactly why in this article.
So, what exactly is a supply zone and a demand zone. This would be best described by a chart
In the image above you see the German stock market DAX. The red zone is marked as a supply zone. This could also be defined as an active resistance level or a place where traders are selling huge amounts. These levels are broader than a resistance line. They are very similar to resistance zones.
On the other side, a Demand zone is a broad area of support, just like the image below.
In the chart above you can see a supply zone or in other words a very broad support level. It is also a level concentrated in buyers. As you can see every time price approaches the supply zone it quickly jumps back up.
Another characteristic of supply and demand zones is the quick price action. As pointed out above, price action is very fast around those levels, so if there are opportunities they are quickly absorbed.
Maximize your profit by copy Our Trade
A very important element of supply and demand trading is the use of candlestick charts in conjunction with it.
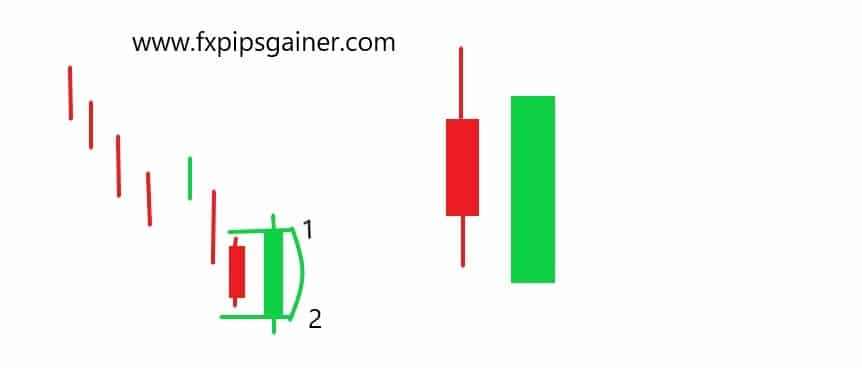
The two most important candlestick patterns used in conjunction with supply and demand levels are the pinbar and the engulfing pattern. The majority of traders using supply and demand zones will be looking for rejections or confirmations of these levels.
Therefore, it is essential that you can recognise at least those two candlestick patterns.
– Pin Bar
– Engulfing
Below is given an example of them both:
In the example above, there are two candlestick patterns- Pinbar and a 2 Bullish Engulfing Pattern. As you can see from the chart above, price quickly jumps higher after those candlesticks have been formed.
As explained before, support and resistance levels are very similar to the zones. The only difference is that zones encompass larger area. The other difference is the way to draw supply and demand zones, but we will come to this later.
In practice, support and resistance and supply and demand zones are beasts from one and the same origin.
If that helps, you can even imagine supply and demand zones as large support and resistance areas with a huge concentration of buyers and sellers respectively.
The good news is that Supply and Demand zones can be used with equal success on all timeframes. I would still recommend that you use them on timeframes higher than 60 minutes. Anything below that consists of a lot of noise and more false signals.
In my experience, the best timeframes to spot supply and demand zones are the 4H and the Daily.
Maximize your profit by copy Our Trade
The best way to find supply and demand zones is to look at a candlestick chart. Here is the order of things to do to spot supply and demand zones:
1. Look at the chart and try to spot successive large successive candles. It is important that price moves a lot.
2. Establish the base (beginning) from which price started the quick move.
3. Usually, before a large move you have a small sideways move- that is where your supply and demand zone is.
Let me give you an example, so you can understand what I mean by large successive candles:
You can see in the image above that the three areas are showing areas of fast-moving price. These are exactly the type of market moves you should be looking for. Now, the question remains- how do we define the supply and demand zones.
The best way to show is through an illustration. Let me draw them, so you can better visualize:
As you can see in the image above, the demand and supply zones are encompassing the base on the beginning of the move. It is very hard to be precise with those levels and here it is more of an art than science.
The good news is that after a while you get used to spot those levels and your eye turns into an automatic scanner.
Maximize your profit by copy Our Trade
Analysts : Bitcoin experiencing ‘shakeout,’ not end of 4-year cycle