Maximize your profit by copy our Trade
Supply and Demand Trading Overview
What are Supply and Demand Zones?
Demand Zone: A price level where the market has previously experienced a sharp increase. Traders mark this zone in anticipation of future buying interest.
Supply Zone: A price level where the market has previously experienced a sharp decline. Traders mark this zone expecting future selling interest.
The Premise of Supply and Demand Trading
The idea is that large institutions (like banks and hedge funds) have significant positions that they cannot fully execute at once. They might leave pending orders at these zones, expecting the market to come back to them.
Common Misconceptions
- Pending Orders vs. Market Orders:
Many traders believe that pending orders at supply and demand zones are what drive price movements. However, it’s market orders—actual trades executed at the current market price—that primarily influence price changes. - Institutional Behavior:
The notion that institutions simply place orders at these zones is misleading. While institutions do analyze supply and demand, their trading strategies are often more complex and involve a range of factors beyond just these zones. - Market Dynamics:
When price reaches a zone, it does not automatically trigger a large move if only pending orders exist. The market needs active buying or selling (market orders) to generate movement.
What Is Liquidity?
Liquidity is the ability to buy or sell something without causing a large price change.
Whenever you see the market move, it is due to a lack of liquidity in the market, not because there are more buyers than sellers, as is commonly taught in trading literature.
Market Orders and Liquidity
When someone places a market order, it removes liquidity from the market because the person placing the market order is essentially demanding that his trade is executed immediately. This market order is then matched with someone who has a pending order to sell placed in the market.
If the market order is larger in size than the opposing pending order, part of the market order will be filled, but the rest will remain unfilled. As a result, the market must move higher to seek out additional pending orders to fill the remainder of the market order.
Pending Orders and Liquidity
Pending orders add liquidity to the market because they are the orders with which market orders will be matched.
Retail traders typically do not trade at a size big enough to affect the market price. Consequently, placing and exiting trades is not usually a concern for them. For large institutions, however, entering and exiting trades can pose significant challenges.
Institutional Trading and Stop Hunts
Because their trades are substantial, one primary goal of professional traders is to execute trades with minimal impact on market prices. This often involves finding areas in the market where a lot of liquidity exists.
Pockets of liquidity tend to be found where retail traders place their stop losses. This is why stop hunts are frequently observed in the forex market: professional traders push the price into the location of the stops to unload large trades at the same price without significantly moving the market.
You can actually trade these stop hunts. Check my article “Using Oanda’s Order-Book To Trade Stop Hunts” for a step-by-step guide to finding and trading them.
Why Would Institutions Wait to Get Their Orders Placed?
Before delving into the rules of trading, it’s important to consider why institutions might wait for the market to return to supply and demand zones to place their pending orders.
Questioning the Longevity of Orders
It seems illogical that a zone, which is several years old, would still contain active buy or sell orders. For instance, if there is a supply zone that hasn’t been revisited in three years, does it truly make sense for banks to still have a pending sell order at that level?
The Uncertainty of Market Movements
Additionally, how can banks predict market movements? There is no way for them to know with certainty if the market will return to a specific zone. This uncertainty raises questions about the rationale behind placing orders at such zones in the first place.

Time Spent Away From Zone
One of the primary rules that supply and demand traders use to assess the likelihood of a zone’s effectiveness is the amount of time the market has spent away from that zone.
The Flawed Logic
According to many supply and demand educators, the longer the market has been away from a supply or demand zone, the better the chance of a price reversal upon its return. However, this reasoning is flawed.
Pending Orders and Waiting Time
If a bank places a pending order to buy or sell when the market returns to a supply or demand zone, are they really going to wait a long time for that to occur?
Recent vs. Old Zones
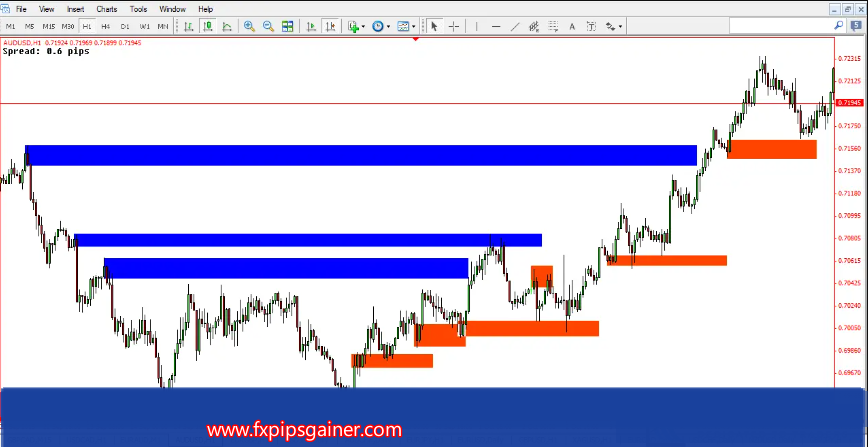
When comparing older supply and demand zones (colored blue) with more recent zones (colored orange), it’s clear that trading zones created recently tends to be far more profitable than those established a long time ago.
For example, if you had traded the six recent zones marked on a chart, each would have led to a successful trade. In contrast, only one of the older zones would have resulted in a profitable trade.
The Strength Of The Move Away
One of the fundamental rules in trading supply and demand is: “The stronger the move away from a zone, the higher the chance the market has of having a strong move away when it eventually returns.”
Understanding the Concept
In other words, if you mark a zone on your charts that has a strong move away from it, the likelihood that this zone will result in a successful trade depends on the magnitude of the move that created the zone.
For instance, if you identify a supply zone that experienced a significant drop, characterized by multiple bearish large-range candles, conventional wisdom suggests that this zone has a high chance of being successful if you decide to trade it.
The Reality of Trading
Unfortunately, the probability of a supply or demand zone resulting in a successful trade has little to do with the strength of the move out of the zone.
How often have you placed a trade at a supply or demand zone following a strong move away, only to watch the market breeze right through it upon return?
The answer is likely: quite frequently. Common teachings in supply and demand trading would label this as a strong area, yet the market often breaches it without hesitation.

How To Determine Which Zones Are Stronger Than Others
Now that we understand a significant move away from a supply and demand zone does not influence the success of a trade, we need to address the question: “How do you determine which zones are stronger than others?”
The Role of Market Trend
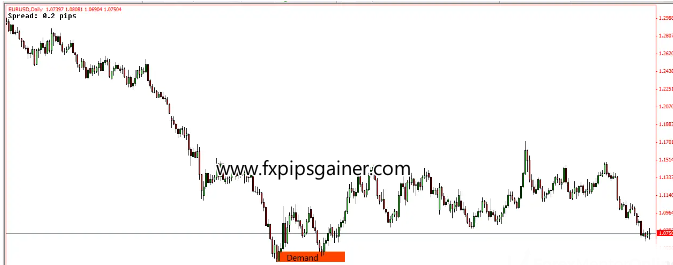
The answer lies in the zone’s relation to the prevailing trend. Consider a demand zone on the daily chart of EUR/USD.
Those who bought when the market was at lower levels have substantial capital at their disposal. Understanding market psychology is key to this.
Market Psychology and Trend Length
As a trend extends, more traders begin to enter positions in its direction. For example, during the last drop visible on the chart before the demand zone was formed, many traders were going short, anticipating lower prices. For the market to rise from this point, buyers need to step in and purchase from these short sellers.
This requires a considerable amount of money—potentially hundreds of millions or billions of dollars. When the market stops falling and begins to rise, it creates a demand zone. This zone has a high probability of being successful, not due to the strength of the move away, but because significant capital has been invested at these levels.
Examples of Strong Zones
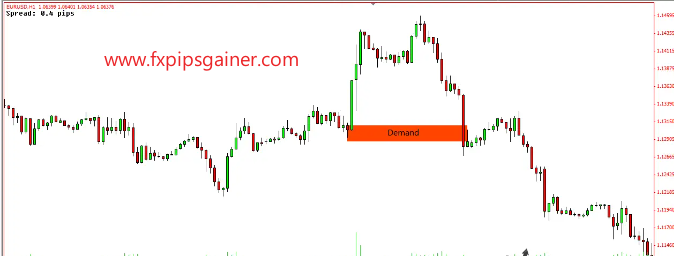
In another example from the 1-hour chart of EUR/USD, we see a significant downtrend followed by a strong, near-vertical move upward. This suggests that someone has entered the market and bought up all the sell orders from those shorting the downtrend.
Again, one must ask: why would someone buy from traders expecting the downtrend to continue if they believed it would?
Identifying High-Probability Zones
The supply and demand zones with the highest probability of success are those situated at trend reversals. A demand zone formed after a prolonged downtrend is much more likely to yield successful trades compared to one formed at the beginning of a down move.
The same principle applies to supply zones: when the market has been rising for an extended period, a supply zone that forms late in the uptrend is far more likely to result in a successful trade than one created at the bottom of the up move.
Time Taken To Return To The Zone
There are two types of trading institutions participate in: intra-day trading and long-term position trading. Understanding how these types affect supply and demand zones is crucial for traders.
1. Intra-Day Trading
Intra-day trading aims to capture many small market movements throughout the trading day, generating small profits in the process. Bank traders who engage in this style will not hold their positions overnight.
This means market makers must adjust prices to areas where these intra-day traders are likely to buy or sell, which predominantly are supply and demand zones.
Therefore, if the market does not return to these zones within a 24-hour timeframe, the probability of those zones working out decreases significantly.
Rule for Supply and Demand Traders
For traders primarily using the 1-hour chart, consider the following rule:
- You should only trade zones that the market returns to within 24 hours.
- If the market fails to return to a marked supply or demand zone within that period, the zone is invalidated and should not be traded again.
Extensive testing has shown that 24 hours is the maximum timeframe for these zones. Anything beyond this drastically decreases the probability of success.
2. Long-Term Position Trading
For those trading supply and demand zones on the daily chart, the market must return to the zone within a month. If it hasn’t, the level becomes invalidated for future trades.
The reason lies in long-term position trading, which is responsible for trends in the forex market. Large institutions collaborate on market direction and manipulate prices to mislead others.
Example: USD/JPY
Consider the USD/JPY example:
- Observe a significant downtrend lasting nearly three years. This prolonged downtrend indicates that most traders are selling.
- Suddenly, a significant upward move occurs, suggesting banks are purchasing large positions from short sellers.
- After this up move, the market retraces, leading traders to believe the downtrend will continue. Many start selling again.
- When the market returns to the area where banks initially bought, they purchase again. This second wave of buying, combined with the liquidation of losing short positions, propels the market significantly higher, establishing a new trend.
Trend Direction in Supply and Demand Trading
Like many forex trading strategies, supply and demand traders incorporate the concept of trend into their market analysis. However, there are common pitfalls in how traders implement this concept.
Common Approach to Trends
Typically, a trader will examine the daily chart and observe that the overall trend is down. Consequently, they may decide to only take trades at supply zones, following the advice to always trade in the direction of the daily trend.
While this approach can be effective when trading off the daily chart, it can lead to issues when traders shift to lower time frames.
The Problem with Lower Time Frames
If a trader takes trades off a lower time frame, such as the 1-hour chart, they may find themselves consistently trading against the trend on that time frame. For example, if the daily trend is down but the 1-hour chart shows an uptrend, the trader may incur unnecessary losses by adhering strictly to the daily trend.
Understanding Time Frame Trends
It’s crucial to recognize that the trend on the time frame from which you are placing trades is the one you should be following.
- If you trade the daily chart, follow the direction of the daily trend.
- If you trade the 1-hour chart, align your trades with the trend on the 1-hour chart.
By understanding and following the correct trend based on your trading time frame, you can improve your chances of success in supply and demand trading. Always ensure that your analysis is aligned with the time frame you are actively trading.
Recent Posts
- Golden Scalping Strategy
- How to Trade Supply and Demand Zones in Forex Using SMC Strategy
- Binary Trading vs Forex: Gambling or Real Business?
- Professional Copy Trading Service Using Real Money Accounts
- Why You Should Avoid Sell Entries in Gold Trading
- Safe Gold Trading Strategy for XM Micro Accounts (Up to 12 Entries)
- What is a Cent Account?
- Smart Money Concepts: Mastering Mitigation Blocks, Breaker Blocks & QML
- Understanding ICT Reclaimed Order Blocks: How Institutions Control Market Moves
- How to Trade Consolidations in Forex and Other Markets
- How to Identify Real Forex Traders vs Fake Screenshot Gurus
- The Gold Accumulation System – A Safe Buy-Only Strategy for Cent Accounts
- The Dark Side of Forex: How Screenshot Scammers Trap New Traders
- CHOCH vs MSS: The Exact Difference Every Smart Money Trader Must Know
- Gold Buy-and-Hold Strategy Using Cent Account and Compounding Lot Size (No SL Trading Model)
- How to Trade Order Flow Imbalances: Simple Rules for Spotting Buy & Sell Order Blocks
- Copy Our Long-Term Gold Trading Strategy
- Execution Mode vs Outcome Mode — The Professional Approach to Managing Trades
- How I Achieved 80.95% Profit in One Year on HFM Copy Trading
- Why It Took Me 15 Years to Become a Profitable Trader
- How to Read and Interpret Profit Factor in Forex Backtesting
- Understanding the Institutional Accumulation Channel
- Understanding No-Deposit Bonuses in Forex: What You Need to Know
- XAUUSD Analysis Summary
- Gold Price Surge Summary
- XAU/USD(GOLD) Analysis 07/10/2025
- Gold Market Update 07/10/2025
- Gold(XAUUSD) Market analysis 07/10/2025
- Start your journey to Forex success
- আপনার ফরেক্স সফলতার যাত্রা শুরু করুন
- 7 Money Rules for Financial Awareness and Peace of Mind
- Gold Recovers Ahead of Nonfarm Payrolls: Key Insights
- Weekly Market Wrap: Gold Pulls Back Amid Dollar and Bond Rotation
- Copy Our Trade with OneRoyal
- Finding Your Path: How to Choose the Perfect Forex Mentor for Success
- Experience the Stability of a 100% Secure Trading Account!
- The 100% Profitable Trading Approach: Maximize Gains with Minimal Risk
- The Head and Shoulders Chart Pattern
- Bullish and Bearish Rejection Blocks: Identifying Key Trading Opportunities
- Just Market: Is It Worth Your Time and Money?
- Why LiteFinance Stands Out: A Comprehensive Review
- Understanding XAUUSD: Gold Strategy and Central Bank Reserve Management
- Hotforex Copy Trading Service
- Understanding Profit Factor: A Key Metric for Trading Success
- Supply and Demand Dynamics: How Gold Production Affects XAUUSD
- The Safe Haven: Gold as a Strategic Investment During Economic Downturns
- Mastering Deception: How to Scam as a Forex Signal Provider
- The Impact of Rising Bond Yields on Gold (XAUUSD)
- Understanding the Correlation Between Oil Prices and Gold (XAUUSD)
- The Impact of Geopolitical Events on Gold Demand (XAUUSD)


