Maximize your profit by copy Our Trade
SMC, or Smart Money Concepts, is a trading methodology that focuses on understanding the behavior of institutional traders (often referred to as “smart money”) in the forex market. This approach emphasizes market structure, order flow, and the psychology of market participants. Here’s an overview of the key components of SMC for forex trading:
Key Concepts of Smart Money Concepts (SMC)
1. Market Structure
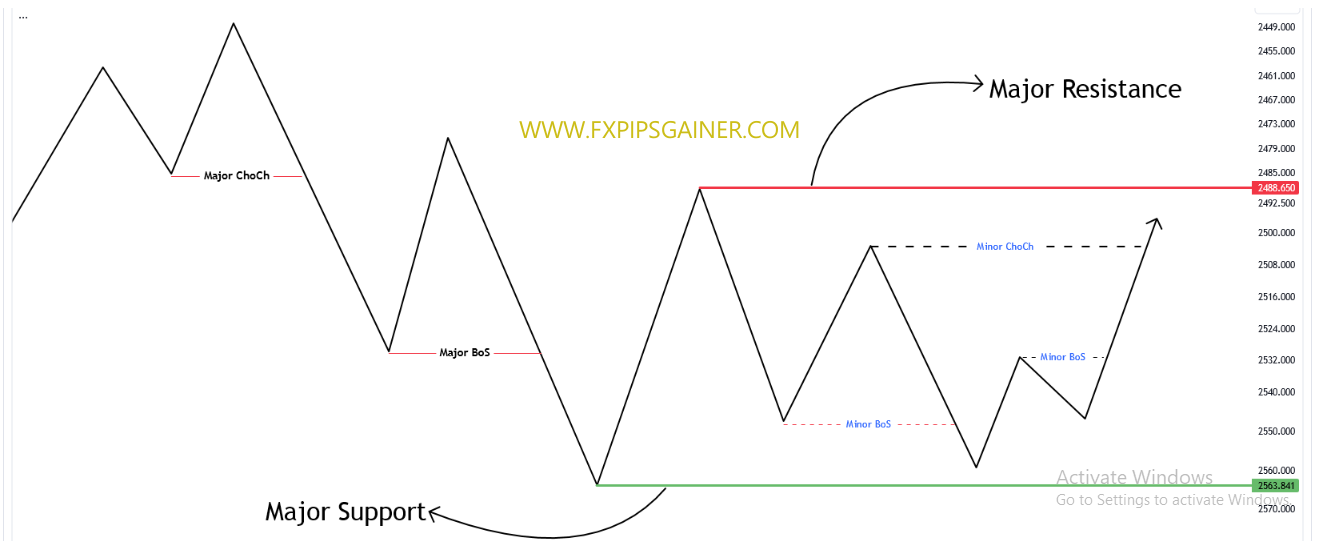
– Higher Highs and Higher Lows (HH, HL): In an uptrend, the price creates higher highs and higher lows.
– Lower Highs and Lower Lows (LH, LL): In a downtrend, the price creates lower highs and lower lows.
– Understanding these patterns helps traders identify the overall trend direction.
2. Liquidity Zones
– Liquidity Pools: Areas where stop-loss orders are clustered, often around significant support and resistance levels. Institutions target these areas to fill their orders.
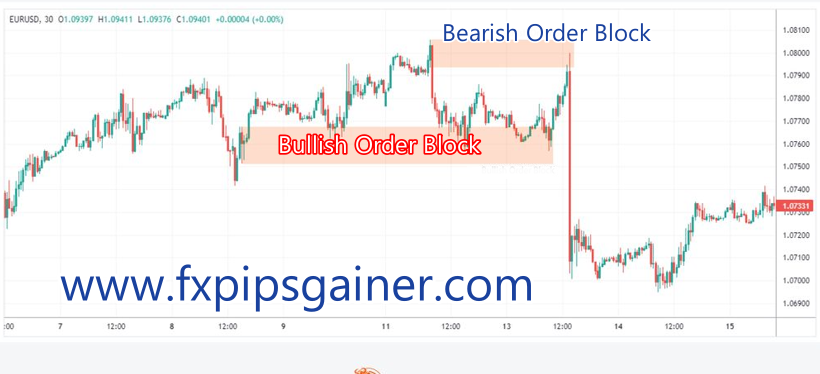
– Order Blocks: Areas of consolidation before significant price moves. These are often the zones where institutional buying or selling has occurred.
3.Order Flow
– Understanding Supply and Demand: Traders analyze how supply and demand dynamics affect price movements. An imbalance between buyers and sellers can lead to significant price changes.
– Market Orders vs. Limit Orders: Recognizing the difference can help assess where liquidity may be present in the market.
4. Smart Money vs. Retail Traders
– Smart Money: Refers to institutional traders who have access to more information, resources, and capital. Their actions often dictate market movements.
– Retail Traders: Individual traders who may not have the same level of insight. SMC aims to align trades with the actions of smart money.
5.Market Sentiment
– Understanding market sentiment helps traders gauge the emotional state of the market. Sentiment can be bullish, bearish, or neutral and affects price movements.
Practical Application of SMC
1. Identifying Entry and Exit Points:
– Traders look for price action around key liquidity zones and order blocks to identify potential entry points. For example, entering a trade when price retraces to an order block after a breakout.
2.Using Price Action:
– Analyzing candlestick patterns, trends, and reversals helps traders make informed decisions based on real-time market behavior.
3. Risk Management:
– SMC emphasizes the importance of managing risk by setting stop-loss orders near key levels and adjusting position sizes based on market conditions.
4. Combining with Other Tools:
– Many traders use SMC alongside other technical analysis tools (like Fibonacci retracements, moving averages, etc.) to enhance their trading strategies.
Details Idea in Smart Money Concept
The Smart Money Concept introduces several foundational ideas that provide traders with a framework to interpret market movements through the lens of institutional activities.
Understanding Institutional Order Blocks
Institutional Order Blocks are price ranges where large institutional investors (like mutual funds, pension funds, or hedge funds) have placed significant buy or sell orders. These blocks can indicate areas of strong buying or selling interest, and they often serve as indicators for future market movements.
When the price approaches these zones again after moving away, it can act like a support or resistance level. If the price returns to an area where a significant buy order was placed, it might bounce back up (support). Conversely, if it returns to a sell order area, it might drop (resistance).
Institutional Order Blocks Example: EUR/USD
1. Initial Movement
– Current Price: EUR/USD is trading at 1.1000.
– Institutional Activity: Large institutional investors place significant buy orders in the range of 1.0900 to 1.0950.
2. Market Reaction
– Due to the strong buying interest, EUR/USD rallies to around 1.1200, driven by demand from both institutional and retail traders.
3. Price Correction
– After reaching 1.1200, some investors take profits, and the price begins to decline, moving back toward the previous buying zone.
4. Return to Order Block
– The price falls and approaches the 1.0900 to 1.0950 range again, where the institutional buy orders were placed.
5. Price Behavior
– As EUR/USD reaches the 1.0900 to 1.0950 zone, buying interest returns, stabilizing the price and leading to a rebound towards 1.1000 and beyond.
Key Takeaways
- The range of 1.0900 to 1.0950 served as a significant area of interest for institutional investors.
- When the price returned to this area, it acted as support, resulting in a price rebound.
- Monitoring these institutional order blocks can help traders identify potential entry points and understand market sentiment.
Breaker Blocks Example: GBP/USD
1. Initial Order Block
– Current Price: GBP/USD is trading at 1.3000.
– Institutional Activity: A significant buy order block is established in the range of 1.2950 to 1.2980.
2. Market Reaction
– The price bounces off this order block, rising to 1.3100 due to strong buying interest from institutional investors and retail traders.
3. Price Correction
– After reaching 1.3100, the price starts to decline as some traders take profits, moving back toward the order block.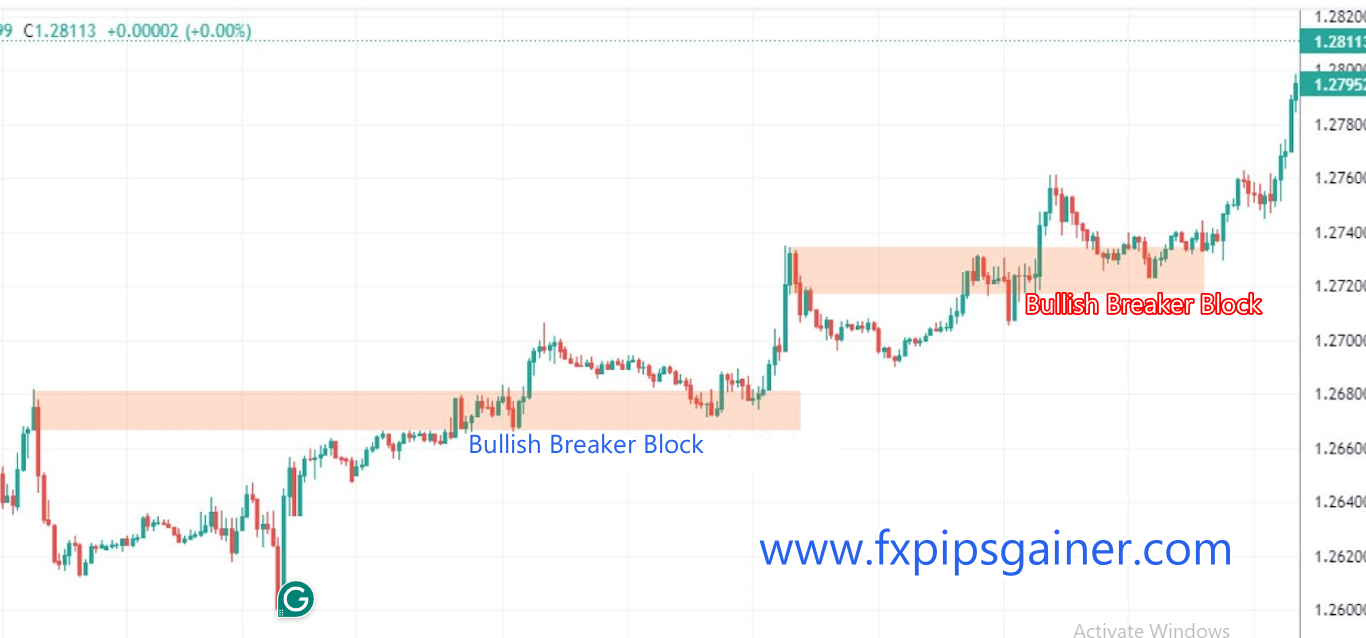
4. Break of the Order Block
– The price drops and breaks through the 1.2950 to 1.2980 order block, falling to 1.2900. This failure indicates that the previous buying interest has diminished.
5. New Price Behavior
– After breaking the order block, the price attempts to rise again but struggles to get back above 1.2950. This area now acts as resistance.
6. Confirming the Breaker Block
– When the price returns to the 1.2950 to 1.2980 range, it fails to break through, confirming that this area has become a new resistance level.
– The price then drops again, reinforcing the idea that the market sentiment has shifted.
Key Takeaways
- The break of the 1.2950 to 1.2980 order block indicates that buying support has weakened.
- After the breakout, this former support level now acts as resistance, preventing the price from moving higher.
- The failure of the order block suggests a change in the direction of “smart money,” signaling traders to adjust their strategies accordingly.
Breaks of Structure (BOS)
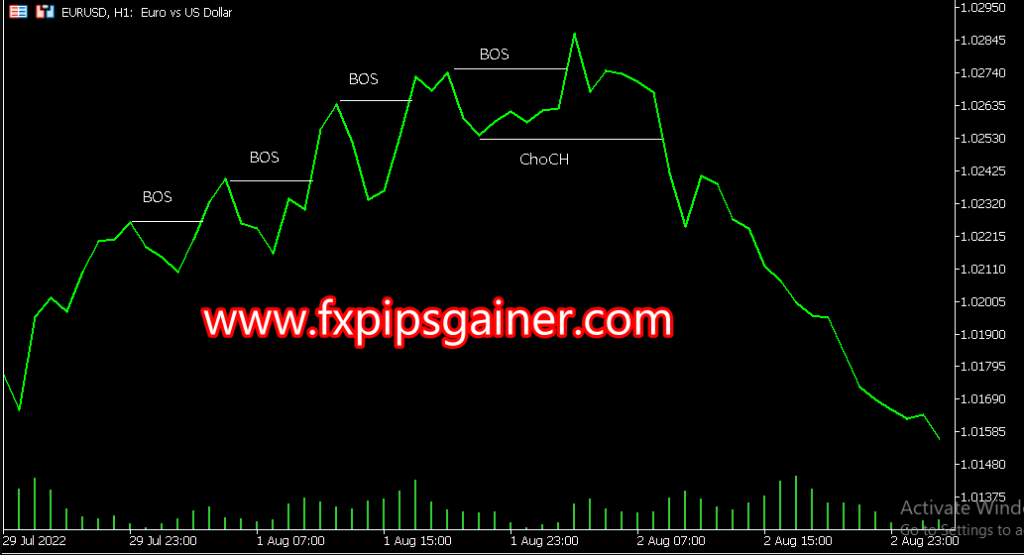
A Break of Structure (BOS) occurs when the price surpasses a significant high or low, indicating a potential change in market trend. It signifies the end of one market phase and the beginning of another, offering clues about the influence of “smart money” on market direction. Recognizing a BOS can be crucial for determining trend direction.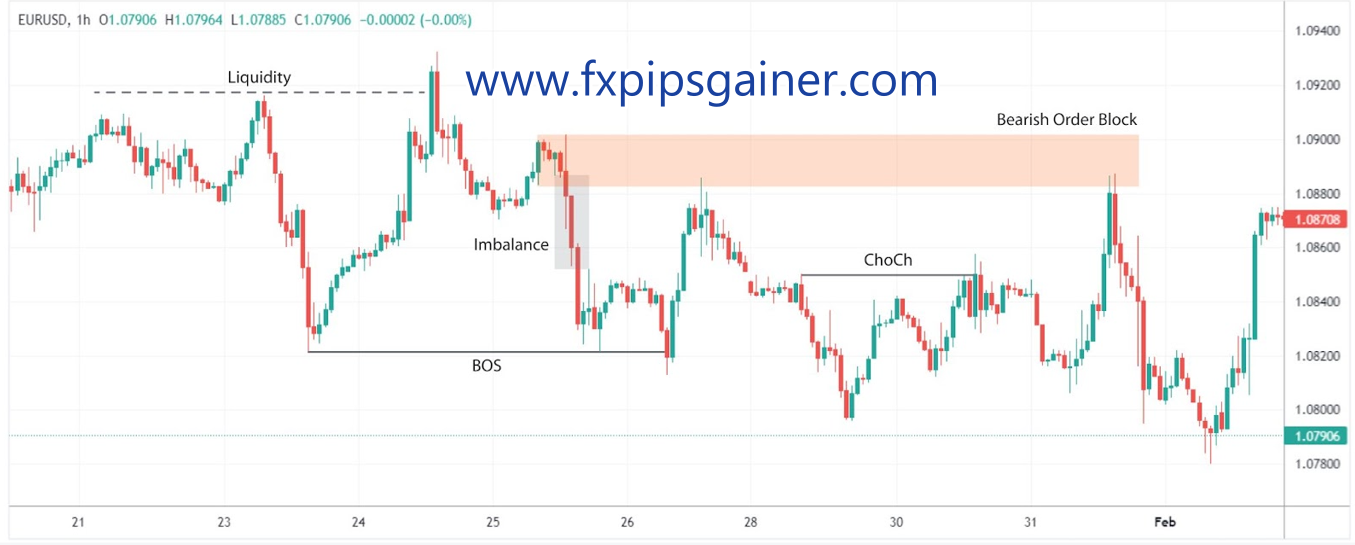
Example: EUR/USD
-Current Price: EUR/USD is trading at1.1200.
– The market has been in a downtrend, with significant lower highs forming. The last swing high is at 1.1300.
– The price moves down and creates a new lower low at 1.1100, indicating the continuation of the downtrend.
– The price then rallies from 1.1100 and surpasses the previous swing high at 1.1300, reaching 1.1350. This break signifies a potential change in market structure.
– After breaking above 1.1300, the price pulls back to this level, which now acts as support, confirming the change in market direction from bearish to bullish.
– Following the pullback, the price starts to rise again, indicating an established uptrend. The BOS at 1.1300 has marked the end of the previous downtrend.
Key Takeaways
- A Break of Structure occurs when the price surpasses significant highs or lows, signaling a potential trend change.
- The break above 1.1300 indicates the end of the downtrend and the beginning of an uptrend.
- Recognizing BOS is crucial for traders to determine market sentiment and adjust their strategies accordingly.
Maximize your profit by copy Our Trade
Change of Character (ChoCH)
A Change of Character (ChoCH) refers to a notable alteration in the market’s behavior, often observed through an abrupt increase in volatility or a shift in price direction. A ChoCH typically follows a Break of Structure (BOS) and confirms a potential trend reversal, suggesting a new phase of market sentiment driven by institutional activities. Recognizing a ChoCH can help traders anticipate market movements and adjust their strategies accordingly.
Example: EUR/USD
– Current Price: EUR/USD is trading at 1.1200.
– The market has recently experienced a Break of Structure (BOS) as the price broke above the previous swing high at 1.1300, reaching 1.1350.
– Following the BOS, the price pulls back to the 1.1300 level, which now acts as support, confirming a potential uptrend.
– As the price approaches 1.1300, an abrupt increase in volatility occurs, characterized by large candlesticks and rapid price movements.
– The price then bounces off 1.1300 and moves sharply upwards, indicating a Change of Character. This movement confirms the bearish-to-bullish trend reversal.
– The new price action suggests that institutional buyers are actively participating, driving the market sentiment towards an uptrend.
Key Takeaways
- ChoCH signifies a notable change in market behavior, often following a BOS.
- The abrupt increase in volatility indicates a shift in price direction and market sentiment.
- Recognizing a ChoCH helps traders anticipate potential trend reversals and adjust their strategies accordingly.
1. Fair Value Gaps (Imbalances)
Fair Value Gaps are areas on the chart where price moves quickly, leaving a gap that indicates an imbalance between supply and demand. These gaps often occur during rapid price movements and signify areas where the market has not had enough time to absorb all buy and sell orders.
– Key Point: Institutional traders often target these gaps for potential returns, suggesting that prices may move back to fill them over time.
– Example: If the price of EUR/USD jumps from 1.1200 to 1.1250 without trading at any prices in between, a Fair Value Gap exists from 1.1200 to 1.1250. Traders may anticipate a return to this gap.
2. Liquidity
In the context of SMC, liquidity refers to areas where “smart money” is likely to execute large orders due to the availability of opposite market orders. These areas are often found around key highs or lows, trendlines, and equal highs/lows.
– Key Point: Liquidity zones are where stop losses and breakout orders are likely resting, creating opportunities for institutional traders to execute large orders.
– Example: If many traders have stop-loss orders just above a significant resistance level, “smart money” may push the price into this area to trigger those stops, creating a bull trap before the price reverses.
3. Accumulations/Distributions
Accumulation and distribution phases indicate periods when “smart money” is either accumulating (buying) or distributing (selling) their positions.
– Accumulation: This occurs at lower price levels, often before a significant uptrend. During accumulation, institutional investors buy up assets while retail traders are generally pessimistic.
– Distribution: This takes place at higher price levels, typically before a downtrend. Here, institutional investors sell their positions while retail traders are overly optimistic.
– Example: In the Wyckoff theory, if GBP/USD trades within a range around 1.3000 for an extended period before breaking upward, this could indicate accumulation. Conversely, if it trades around 1.3500 before dropping, it may signify distribution.
Key Takeaways
- Fair Value Gaps highlight imbalances in supply and demand, often targeted by institutional traders.
- Liquidity zones are areas where “smart money” executes large orders, often around stop-loss points.
- Accumulations and distributions reveal the buying and selling phases of institutional investors, indicating potential future market direction.
Steps to Trade Smart Money Concepts in Forex
1. Determining the Trend Using Breaks of Structure (BOS) and Change of Character (ChoCH)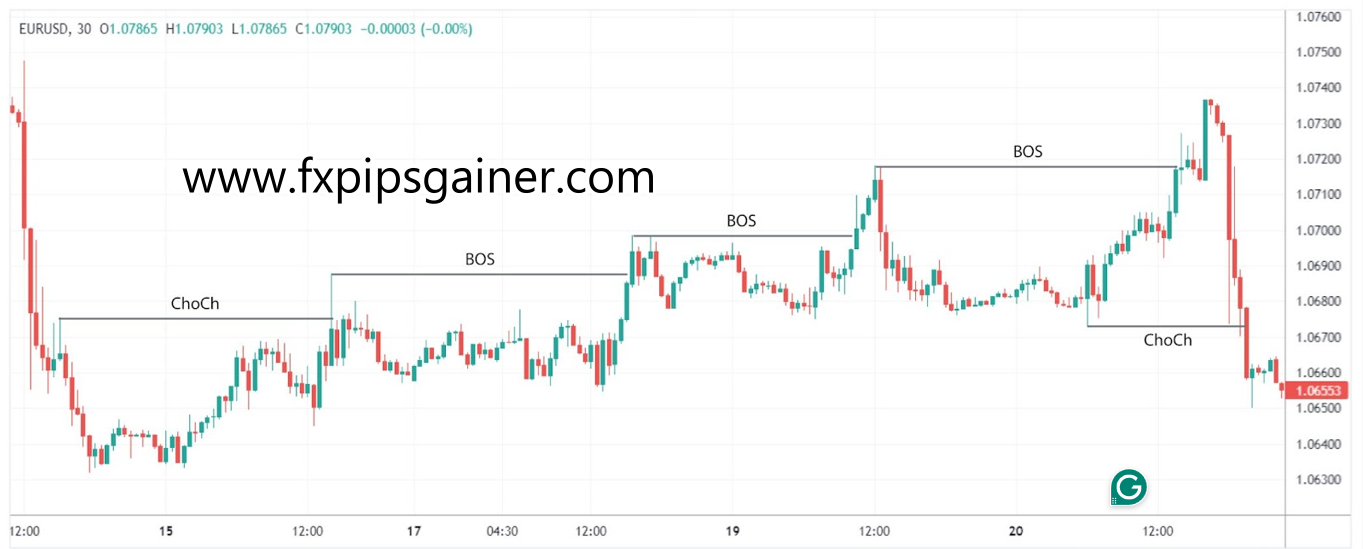
Traders can identify the market trend by observing Breaks of Structure (BOS) and Changes of Character (ChoCH). A trend is typically recognized by a series of higher highs and higher lows (uptrend) or lower lows and lower highs (downtrend).
– Trend Continuation: A clear BOS occurs when the price surpasses a significant high or low, signaling a shift in market direction. Following this, a ChoCH indicates an abrupt change in market behavior, confirming the new trend.
– Example: If EUR/USD moves from 1.1000 to 1.1050 (BOS) and then pulls back to 1.1025 (ChoCH), traders recognize an uptrend is forming.
2. Identifying an Order Block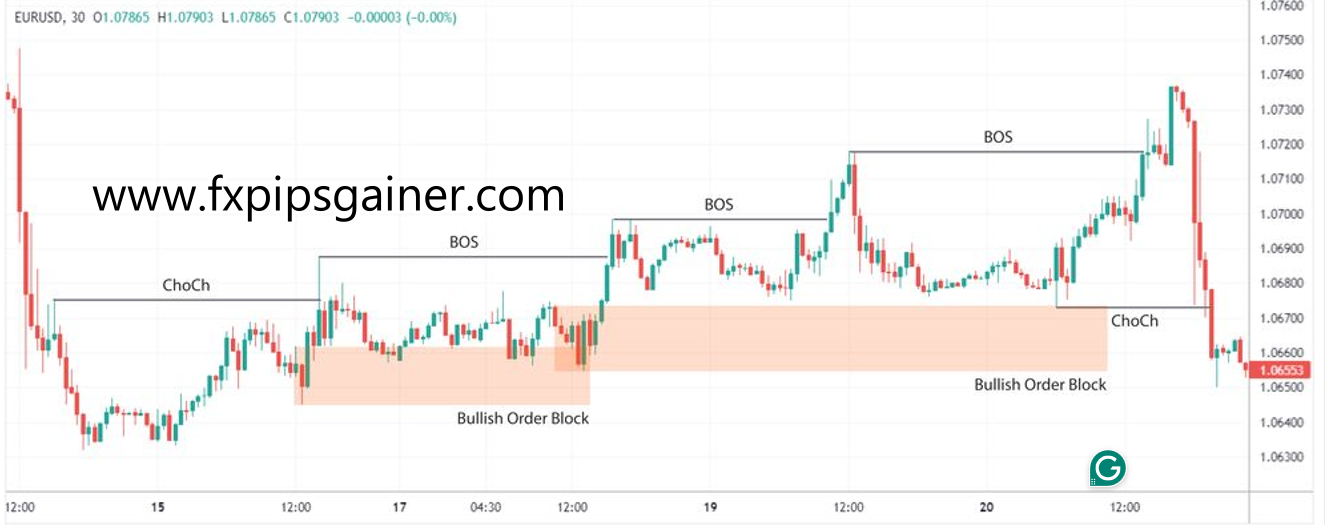
The next step involves pinpointing areas where institutional traders are likely participating, often signaled by a BOS or ChoCH. Traders look for the range that initiated this shift, marking an order block.
– Validation: This is more accurate if there’s a pronounced move away from the range, creating a Fair Value Gap, or if it aligns with a Breaker Block. Additionally, the presence of liquidity near these points can validate the significance of the order block.
– Example: If the price of GBP/USD breaks above 1.3000 with a strong bullish move, the range from 1.2950 to 1.3000 becomes an order block.
3. Finding an Entry Point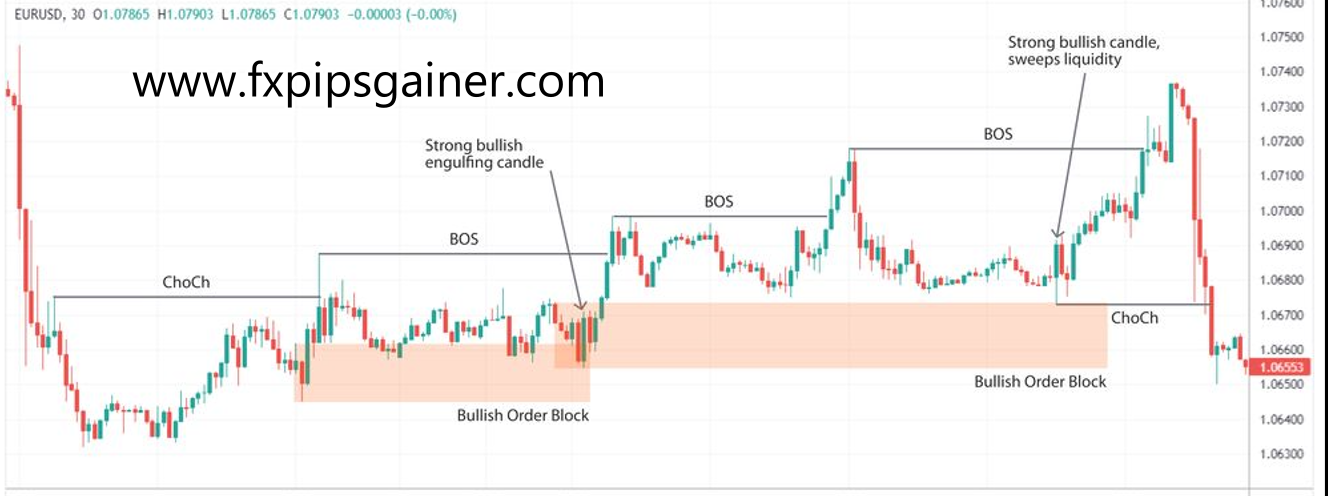
Once an order block is identified, finding a strategic entry point is crucial. Traders typically place limit orders at the edge of the block or wait for specific candlestick patterns, such as hammers, shooting stars, or engulfing candles.
– Entry Signals: These patterns suggest a possible continuation of the trend, providing cues for entry. Other tools, like Fibonacci retracements or technical indicators, can also help identify an entry point within SMC.
– Example: After identifying the order block from 1.2950 to 1.3000 in GBP/USD, a trader may place a buy limit order at 1.2960, looking for a bullish reversal indicated by a hammer candlestick.
Key Takeaways
- Identify the trend using BOS and ChoCH to align with market momentum.
- Locate order blocks to understand where institutional traders are likely active.
- Find strategic entry points using candlestick patterns and additional tools for enhanced accuracy.
Recent Posts
- Finding Your Path: How to Choose the Perfect Forex Mentor for Success
- Experience the Stability of a 100% Secure Trading Account!
- The 100% Profitable Trading Approach: Maximize Gains with Minimal Risk
- The Head and Shoulders Chart Pattern
- Bullish and Bearish Rejection Blocks: Identifying Key Trading Opportunities
- Just Market: Is It Worth Your Time and Money?
- Why LiteFinance Stands Out: A Comprehensive Review
- Understanding XAUUSD: Gold Strategy and Central Bank Reserve Management
- Hotforex Copy Trading Service
- Understanding Profit Factor: A Key Metric for Trading Success
- Supply and Demand Dynamics: How Gold Production Affects XAUUSD
- The Safe Haven: Gold as a Strategic Investment During Economic Downturns
- Mastering Deception: How to Scam as a Forex Signal Provider
- The Impact of Rising Bond Yields on Gold (XAUUSD)
- Understanding the Correlation Between Oil Prices and Gold (XAUUSD)
- The Impact of Geopolitical Events on Gold Demand (XAUUSD)
- Fundamental Strategy Overview: XAUUSD (Gold)
- Understanding the Role of Gold (XAUUSD) as an Inflation Hedge
- How Central Bank Interest Rates Influence Gold Demand
- Gold Holding Trading System
- From Novice to Pro: Navigating the ICT Propulsion Block in Trading
- Single Candle Order Block
- Is Scalping Right for You? Understanding the Advantages and Disadvantages
- The Dangers of Screenshot Trading: What You Need to Know
- Guidance for New Traders in Forex
- Forex Signal
- Understanding Market Psychology in Trading
- The Power of Order Blocks: Key Concepts Every Trader Should Know
- Understanding Imbalance and Fair Value Gaps (FVG)
- External and Internal Structure
- Causes of Market Pullbacks: What Every Investor Should Know
- Highs and Lows in Financial Markets: Key Concepts for Traders
- The Definitive Supply and Demand Trading Guide for Forex Traders
- Trading the Hanging Man with Pivot Points
- Trading the Hanging Man with Fibonacci Retracement
- Navigating Perfect Money: Pros and Cons You Need to Know
- Mastering the Super Signal Strategy with Donchian Channels
- Why Many Traders Lose in Forex: A Focus on Gold (XAU/USD)
- Beware of Forex Market Manipulation: Essential Insights for Traders
- Trading the Hanging Man with RSI Divergences
- The Forex Trader’s Blueprint: Understanding Supply and Demand Dynamics
- Trading the Hanging Man with Moving Averages
- Hanging Man Candlesticks Pattern
- Smart Money Concept(SMC) in Forex Market
- Advantages of Exness Forex Broker
- Trading the Hanging Man with Resistance Levels
- Bullish Harami Candlesticks Pattern
- Scalping Trading Strategy
- Trading with Confidence: A Closer Look at HFM Broker
- Swing Trading Strategy
