Two timeframe trend following strategy
In this strategy we used two chart for different two timeframe like H1 and H4 or M30 and H1 or H4 and D1.
Best combination is H4 and D1 timeframe.D1 for trend identification and H4 for signal or entry collection that means signal chart.
For this strategy we need two Exponential Moving Average(EMA) that are 34 EMA and 55 EMA.
Here we described two timeframe H4 for trend and H1 for signal chart
For an uptrend, the trend should meet the following conditions:
#Price action is above the two moving averages
#Price stays above the Exponential Moving Averages(EMA)
#The 34 EMA is above the 55 EMA and stays above the 55 EMA
#The EMAs are sloping upwards for most of the time as they follow the trend.
For a downtrend, the same applies just in the opposite direction:

#Price action is below the two moving averages
#Price stays below the moving averages
#The 34 EMA is below the 55 EMA and stays below the 55 EMA
#The EMAs are sloping downwards for most of the time as they trail behind the trend
An example of a downtrend with the moving averages is shown on the following chart.
These two Moving Averages are act as a Support and Resistance area.When Uptrend on Higher timeframe act as support on lower timeframe.
It is around and inside of this moving average zone that the best trading opportunities for this trend trading strategy are to be found.
We are trying to profit on the swings in the direction of the trend. So, for this reason, we want to join the trend on the retracements.
Entry rules:

- There needs to be a trend on the 4h with the moving averages lined up as described earlier.
- We need to wait for a retracement to start and for the price to move towards the two moving averages.
- Once the retracement reaches the area around and between the moving averages we switch to the 1h timeframe to look for entries.
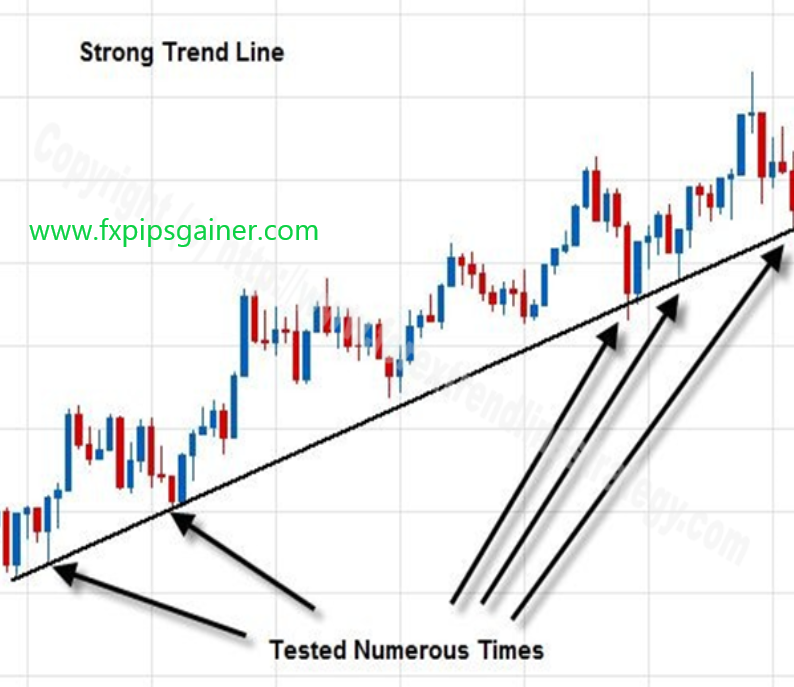
- There needs to be a retracement trendline (counter the direction of the trend) that has been touched at least 3 times (as shown in the example below). This will usually be a continuation chart pattern at the same time (on the 4h chart) like a triangle or a channel.
- On the 1h chart, wait for a breakout with a close of the retracement trendline in the direction of the larger trend (on the 4h timeframe).
- Enter on the breakout once price closes past the trendline (on 1h chart).
An example of how an entry with this strategy would look like is shown below.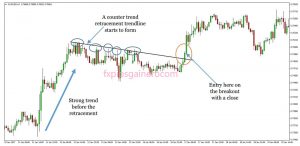
For this particular case, we would place the stop at 30% of the daily average true range below the entry point. On that day, the ATR was 72 pips for the AUDUSD pair, so 30% of 72 is 21.6 which means we would place the initial stop for this trade at 22 pips + the spread.
Stop loss rules are explained below.
Initial stop loss placement:
- Place the ATR (average true range) indicator on the D1 chart.
- Set the stop loss to 30% of the daily ATR behind your entry level (which is the break of the trendline).
- Add the spread to the stop loss (for some more exotic currency pairs the spread can often be 15 or more pips which can make a big difference on the 1-hour timeframe in terms of when your stop loss will be triggered).
For example:
Take the EURUSD pair which has about 100 pips usual daily range. If you entered a trade with this strategy on EURUSD, then your stop loss would be 30% of 100 which equals 30 pips plus the spread, which is usually around 1 – 2 pips for EURUSD. So, in total the stop loss, in this case, would be 32 pips.
Risk management:
After you’ve entered the trade you need to manage that stop loss and trail it in order to be able to capture the maximum profit from the trend. Here is how this strategy works:
- Once the price has moved 30% of the daily ATR in profit, move the stop loss to break even.
- If at any point in time during the trade a counter-trend retracement trendline starts to form on the 1-hour chart then exit the trade.A counter-trend retracement trendline would be a trendline that is touched 3 times. Once this happens there is a higher probability that a new retracement or even a reversal has started. Hence it’s better to exit the trade and wait for a new opportunity.
Take profit rules:
Because this is a trend trading strategy we will use a trailing stop for exiting the trade. This allows us to profit on a bigger part of the move.
There are some specific rules for this trailing stop order:
In an uptrend:
- As the price makes new higher highs, find the most recent highest high.
- Take the candle of that highest high.
- Find the low of this candle.
- Count backwards for 5 previous lows from the low of that candle.Note: Only lower lows count. Lows that are the same as or higher than the previous lows are to be omitted.
- Place the stop a few pips lower than the low of the fifth candle.
In a downtrend:
- As the price makes new lower lows, find the most recent lowest low.
- Take the candle of that lowest low.
- Find the high of this candle.
- Count backwards for 5 previous highs from the high of that candle.Note: Only higher highs count. Highs that are the same as or lower than the previous highs are to be omitted.
- Place the stop a few pips higher than the high of the fifth candle.
Here’s how this trailing stop looks on a chart.
The blue arrows are the starting point of the count and the line is the stop loss placement for that point in time. The numbers are an example of how to count the candles to determine the stop. You can see here how lower highs are left out until the next higher high backwards is found.
As the downtrend progresses with each new lower low, the counting for the trailing stop should re-done again and the stop moved lower.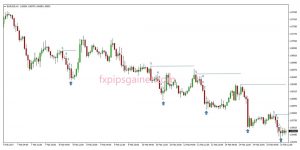
[…] Two timeframe trend following strategy […]
[…] Two timeframe trend following strategy […]
[…] Two timeframe trend following strategy […]
[…] Two timeframe trend following strategy […]