

 “
“
The Reversal system aims to do the opposite of the Pullback system: instead of catching trends, it’s designed to trade their reversals. It looks for a different pattern than a Pullback system and takes different actions. This is why each trade needs to have the name of a specific system attached to it – to make you focus on the pattern you’re aiming to catch.
In this book we’ll focus on going long: catching the ends of downtrends and buying upside reversals. Let’s leave catching downside reversals and selling short for a later, more advanced stage of your development.
The reversal system uses the charts of two timeframes. We begin by scanning the weeklies, looking for stocks whose declines appear to be slowing down and finding support. Stay away from sharply falling stocks – don’t try to “catch a falling knife.” Look for slower declines that appear to be bottoming out. A pattern of a sharp bottom, a reflex rally, and then a slower retest of the lows may offer an attractive buying opportunity when accompanied by a bullish divergence. A good place to look for this pattern is among industry groups that are currently out of favor with the general public.
* The weekly chart shows a double bottom, with the second lower than the first
* The weekly Impulse system stopped being red.
* Either weekly or daily chart shows a bullish divergence of MACD-Histogram
* On the daily chart prices are in or near the value zone.
* The daily Impulse system is not red.
* Buy near the value zone on the daily chart.
* Place a stop near the low of the second lowest recent bar or 1.5 ATRs below your entry, whichever is lower. We’ll discuss ATRs in a chapter on stops.
* Set a target near the fast EMA on the weekly chart.
“
In a nutshell, we’ll identify our candidates on the weekly chart, then switch to the daily chart and look for a combination of two patterns:
* A stock falls to a new low but then rallies to close above its recently broken line of support.
* An indicator, such as MACD-Histogram, traces a bullish divergence in either timeframe.
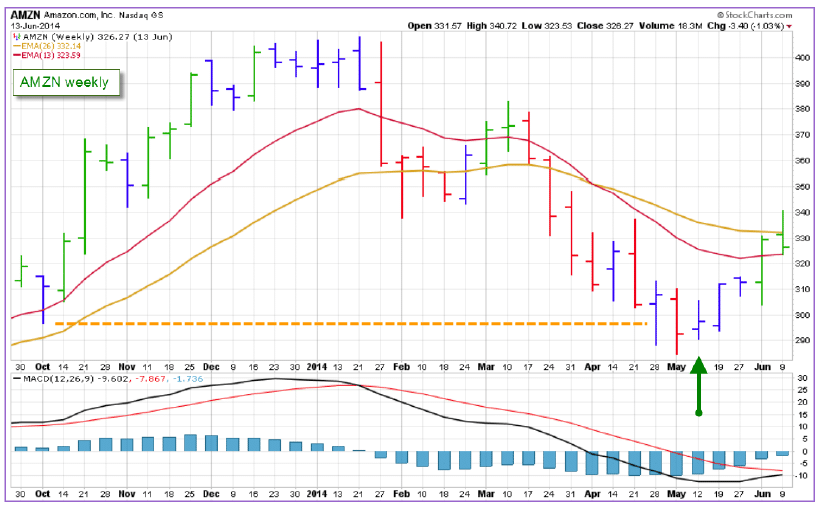
This weekly chart shows a decline of AMZN which slowed down after hitting support (marked by an orange dashed line). Remember that support is not rigid – it’s more like a wire fence than a sheet of glass. Bears keep pushing weekly bars down, but cannot sink an entire bar below that line. During the bar marked with a green arrow weekly MACD-Histogram ticked up, turning the Impulse blue and permitting buying.
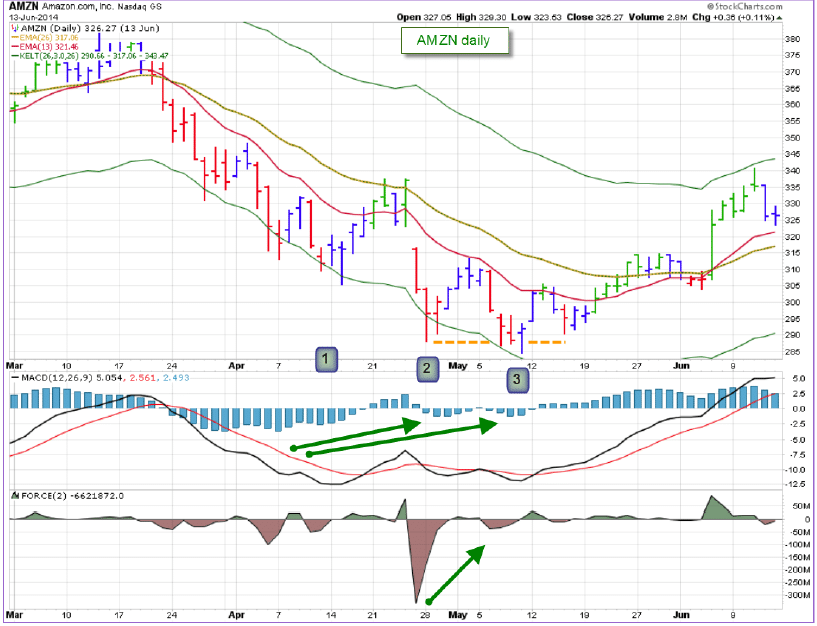
Just as the decline on the weekly chart was finding support, the daily charts showed multiple bullish divergences. There was a triple bullish divergence of MACD-Histogram and a bullish divergence of Force Index, in which the first bottom was a downspike – another bullish signal. There was also a false downside breakout at bottom 3. These signals kept coming one after another, reinforcing each other.
After catching an upside reversal and profiting from it, remain aware of continuing opportunities to follow that stock in its new uptrend. You can now switch to the Pullback system, buying in the value zone and taking profits at the upper channel line.