Maximize your profit by copy our Trade
What Are Highs and Lows in Trading?
Highs and lows are key metrics in trading that represent the highest and lowest prices at which a security or asset has traded over a specific time frame. Understanding these values is crucial for traders as they provide insights into market movements and help in making informed trading decisions.
Key Definitions:
- Highs: The highest price at which a security has traded during a specified time period.
- Lows: The lowest price at which a security has traded during the same time period.
Time Periods:
- 20-Day High/Low: Refers to the highest and lowest prices recorded in the last 20 trading days.
- 52-Week High/Low: Represents the highest and lowest prices achieved over the past year.
What Are Higher Highs and Lower Lows?
When traders discuss higher highs and lower lows, they are examining price movements of assets to identify market trends. Understanding these concepts is crucial for effectively analyzing market behavior and making informed trading decisions.
Definitions
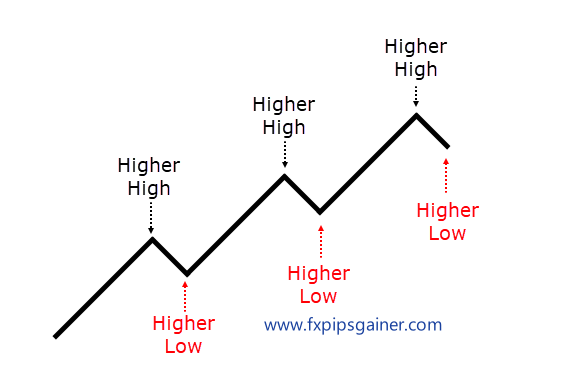
- Higher High: This occurs when the closing price of a security is higher than the previous high. For example, if a stock closed at $50 yesterday and then closes at $52 today, the $52 is considered a higher high. This pattern indicates a potential upward trend, suggesting that the asset is gaining strength.
- Higher Low: This happens when the closing price is higher than the previous low. For instance, if the stock closed at $48 two days ago and then at $49 today, the $49 is a higher low. This suggests continued upward momentum and strengthens the case for an upward trend.

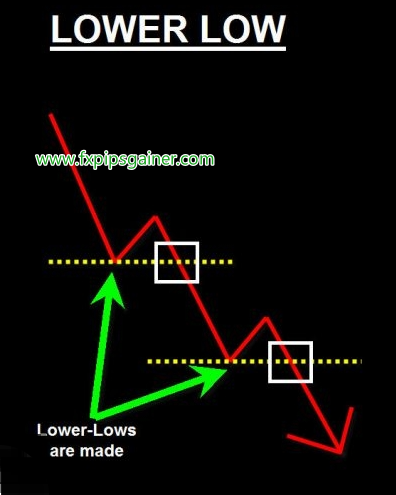
- Lower Low: This occurs when the closing price is lower than the previous low. For example, if a stock closed at $47 yesterday and then closes at $45 today, this $45 is a lower low. This pattern indicates a possible downward trend, suggesting that the asset is losing strength.
- Lower High: This happens when the closing price is lower than the previous high. If a stock closed at $51 yesterday and then at $50 today, the $50 is a lower high. This reinforces the notion of a downward trend, indicating that sellers are gaining control.
Trend Indicators
Understanding trend indicators is essential for traders as they provide insights into the overall direction of the market. The two primary trends are uptrends and downtrends, each characterized by specific patterns in price movements.
Uptrend
An uptrend is characterized by a series of higher highs and higher lows. This pattern indicates a bullish market sentiment where buyers are in control, pushing prices upward.
- Higher Highs: Each successive peak in price is higher than the previous peak, demonstrating increasing buying pressure.
- Higher Lows: Each successive low is also higher than the previous low, indicating that sellers are unable to push prices down as far as before.
Example: If a stock moves from $50 to $52 (higher high) and then pulls back to $51 (higher low), and then moves to $54 (another higher high), this series of movements illustrates an uptrend. Traders often look for buying opportunities during uptrends, anticipating that the price will continue to rise.
Downtrend
A downtrend is characterized by a series of lower highs and lower lows. This pattern indicates a bearish market sentiment where sellers are dominating, pushing prices downward.
- Lower Highs: Each successive peak in price is lower than the previous peak, showing decreasing buying pressure.
- Lower Lows: Each successive low is also lower than the previous low, indicating that sellers are successfully pushing prices down further.
Example: If a stock declines from $50 to $48 (lower low) and then retraces to $49 (lower high), followed by a drop to $46 (another lower low), this series of movements illustrates a downtrend. Traders may seek selling opportunities during downtrends, expecting that the price will continue to fall.
Trade Now
What Is Higher High/Lower Low Strategy?
The higher high/lower low strategy involves traders using patterns of higher highs and lower lows to make trading decisions. This strategy is designed to identify potential trends in asset prices based on historical price movements.
Understanding the Strategy
This strategy is predicated on the idea that price movements often follow patterns that can indicate future trends. Traders look for:
- Higher Highs: Indicating potential upward momentum.
- Higher Lows: Suggesting that prices are stabilizing at higher levels.
- Lower Lows: Indicating potential downward momentum.
- Lower Highs: Suggesting that prices are stabilizing at lower levels.
Challenges of the Strategy
While the higher high/lower low strategy can be useful, it is generally considered rare and comes with challenges:
- Instability: A higher high/lower low pattern often signals market instability. This volatility makes it difficult to predict future price movements reliably.
- Market Conditions: The strategy may perform differently under varying market conditions, requiring traders to adapt quickly.
- Experience Required: Traders may need significant experience and knowledge of market dynamics to effectively implement this strategy.
Combining with Other Indicators
Due to its inherent challenges, traders often combine the higher high/lower low strategy with other technical indicators or market analysis tools. This can help in:
- Confirming trends and reducing uncertainty.
- Identifying entry and exit points more effectively.
- Enhancing overall trading strategies by providing a more comprehensive view of market conditions.
While the higher high/lower low strategy can be a valuable tool for traders, it requires careful consideration and often needs to be supplemented with additional analysis to navigate the complexities of the market effectively.
What Are Equal High and Equal Low?
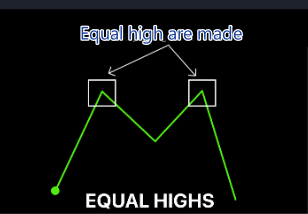
Equal highs and equal lows are terms used in technical analysis to describe specific price levels on a chart where the asset has reached the same price multiple times. These price points can provide important insights into market behavior and potential trading strategies.
Equal High
An equal high occurs when the price of a security reaches the same peak level on two or more occasions. This pattern often suggests a resistance level, where sellers are consistently able to push the price down after it reaches that high.
Example: If a stock price hits $100 on three different occasions but fails to exceed that price, $100 is considered an equal high. Traders may interpret this as a sign that the stock is facing strong selling pressure at that level.
Equal Low
An equal low occurs when the price of a security reaches the same low level on two or more occasions. This pattern often indicates a support level, where buyers are consistently able to push the price up after it reaches that low.
Example: If a stock price drops to $50 on three different occasions but does not fall below that price, $50 is considered an equal low. Traders may view this as a sign that the stock has strong buying interest at that level.
Importance in Trading
- Support and Resistance: Equal highs and lows can help traders identify key support and resistance levels in the market. These levels can be used to make informed trading decisions.
- Market Sentiment: The presence of equal highs may indicate a bearish sentiment, while equal lows may indicate a bullish sentiment. Traders often look for breakouts above equal highs or breakdowns below equal lows to signal potential trend changes.
- Entry and Exit Points: Traders can use equal highs and lows to establish entry and exit points for their trades, utilizing them as part of their overall technical analysis strategy.
How to Identify Lower Highs and Higher Lows Pattern
Identifying lower highs and higher lows is crucial for developing trading strategies, especially in downtrends. Recognizing these patterns can help traders make informed decisions about when to enter or exit trades.
1. Chart Analysis
Start by using either candlestick or line charts to visualize price movements. These charts provide a clear representation of how the price of the security has changed over time.
2. Identify Price Points
Next, look for peaks and troughs in the chart:
- Peaks: These are the high points where the price reaches a maximum before it starts to decline. Identify consecutive peaks to find lower highs.
- Troughs: These are the low points where the price reaches a minimum before it begins to rise. Identify consecutive troughs to find higher lows.
Mark each high and low point clearly on your chart. This can be done using horizontal lines or annotations to help visualize the patterns.
Example
Consider the following price movement of a security:
- Price closes at $50.
- Price then rises to $52 (this is a higher high).
- Next, the price drops to $48 (this is a higher low).
This sequence indicates an upward trend, as the price has established a higher high and a higher low. Traders may interpret this pattern as a signal to consider entering a long position, anticipating further price appreciation.
By following these steps, traders can effectively identify lower highs and higher lows, which are essential for understanding market dynamics and making strategic trading decisions.
Recent Posts
- Golden Scalping Strategy
- How to Trade Supply and Demand Zones in Forex Using SMC Strategy
- Binary Trading vs Forex: Gambling or Real Business?
- Professional Copy Trading Service Using Real Money Accounts
- Why You Should Avoid Sell Entries in Gold Trading
- Safe Gold Trading Strategy for XM Micro Accounts (Up to 12 Entries)
- What is a Cent Account?
- Smart Money Concepts: Mastering Mitigation Blocks, Breaker Blocks & QML
- Understanding ICT Reclaimed Order Blocks: How Institutions Control Market Moves
- How to Trade Consolidations in Forex and Other Markets
- How to Identify Real Forex Traders vs Fake Screenshot Gurus
- The Gold Accumulation System – A Safe Buy-Only Strategy for Cent Accounts
- The Dark Side of Forex: How Screenshot Scammers Trap New Traders
- CHOCH vs MSS: The Exact Difference Every Smart Money Trader Must Know
- Gold Buy-and-Hold Strategy Using Cent Account and Compounding Lot Size (No SL Trading Model)
- How to Trade Order Flow Imbalances: Simple Rules for Spotting Buy & Sell Order Blocks
- Copy Our Long-Term Gold Trading Strategy
- Execution Mode vs Outcome Mode — The Professional Approach to Managing Trades
- How I Achieved 80.95% Profit in One Year on HFM Copy Trading
- Why It Took Me 15 Years to Become a Profitable Trader
- How to Read and Interpret Profit Factor in Forex Backtesting
- Understanding the Institutional Accumulation Channel
- Understanding No-Deposit Bonuses in Forex: What You Need to Know
- XAUUSD Analysis Summary
- Gold Price Surge Summary
- XAU/USD(GOLD) Analysis 07/10/2025
- Gold Market Update 07/10/2025
- Gold(XAUUSD) Market analysis 07/10/2025
- Start your journey to Forex success
- আপনার ফরেক্স সফলতার যাত্রা শুরু করুন
- 7 Money Rules for Financial Awareness and Peace of Mind
- Gold Recovers Ahead of Nonfarm Payrolls: Key Insights
- Weekly Market Wrap: Gold Pulls Back Amid Dollar and Bond Rotation
- Copy Our Trade with OneRoyal
- Finding Your Path: How to Choose the Perfect Forex Mentor for Success
- Experience the Stability of a 100% Secure Trading Account!
- The 100% Profitable Trading Approach: Maximize Gains with Minimal Risk
- The Head and Shoulders Chart Pattern
- Bullish and Bearish Rejection Blocks: Identifying Key Trading Opportunities
- Just Market: Is It Worth Your Time and Money?
- Why LiteFinance Stands Out: A Comprehensive Review
- Understanding XAUUSD: Gold Strategy and Central Bank Reserve Management
- Hotforex Copy Trading Service
- Understanding Profit Factor: A Key Metric for Trading Success
- Supply and Demand Dynamics: How Gold Production Affects XAUUSD
- The Safe Haven: Gold as a Strategic Investment During Economic Downturns
- Mastering Deception: How to Scam as a Forex Signal Provider
- The Impact of Rising Bond Yields on Gold (XAUUSD)
- Understanding the Correlation Between Oil Prices and Gold (XAUUSD)
- The Impact of Geopolitical Events on Gold Demand (XAUUSD)


