

 “
“
Warren Buffett, perhaps the greatest living investor, says that whenever you buy a stock, you become a partner with a manic-depressive fellow he calls Mr. Market. That fellow runs up to you every day, offering to sell you his shares or to buy you out. Most of the time you should ignore him because he is crazy, but there are two exceptions.
First, when Mr. Market becomes depressed, he may offer to sell you his shares for a song, and that’s when you should buy. Second, when Mr. Market becomes manic, he may offer you a crazy price for your shares – and that’s when you should sell. These prescriptions are logical but hard to follow because Mr. Market’s mood is very infectious. Most people want to buy when he is manic (near the top) and sell when he is depressed (near the bottom).
We need to diagnose Mr. Market’s condition and instead of becoming infected by it do the exact opposite – buy when he is depressed and sell when he is manic.
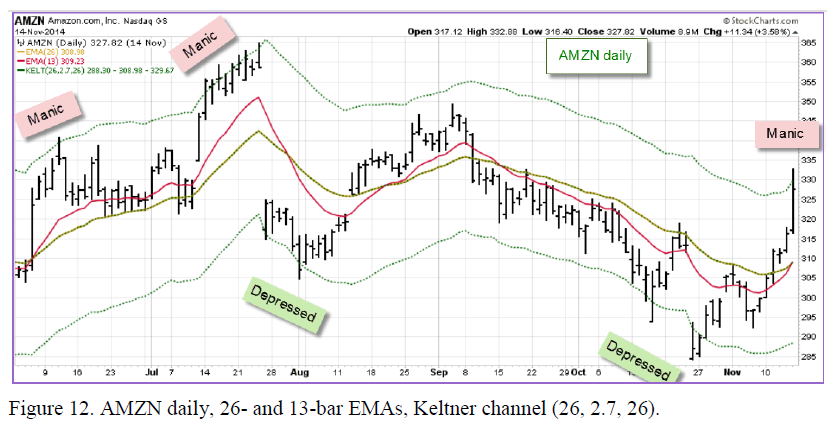
The tool that will help us do that is an envelope or a channel. It consists of two lines parallel to a moving average – one line above and the other below. A well-drawn channel contains approximately 95% of prices for the past 100 bars. What’s inside a channel is normal, what’s above is mania and what’s below is depression. Channels help us recognize Mr. Market’s extremes – and trade against them.
Remember that a channel is a tool, not a complete trading system. Prices dipping below their channel shouldn’t be taken as an automatic buy signal, and prices rising above it shouldn’t be taken as an automatic sell signal. We’ll use several technical indicators, including EMAs and channels, as building blocks from which we’ll construct trading systems in later chapters.
There are several methods of building channels. The most basic and straightforward is to draw two lines parallel to a slow EMA. For example, if you use a pair that consists of a 13-day and a 26-day EMA, build the channel around the 26-day EMA. If at the right edge of the screen your EMA stands at $100 and you decide to use a 5% channel, the upper channel line will be at $105 and the lower at $95.
Such channels are fine if you track a very small number of stocks because you can easily find the proper percentage for every stock. Some stocks require wider channels than others. Channels on the weekly chart have to be twice as wide as the daily channels. Because of these complexities, traders look for channels that automatically adjust their width to the volatility of any stock or index.
“
Keltner channels fit the bill. They are based on the concept of Average True Range (ATR), a sensitive measure of any stock’s volatility. When a stock approaches its upper Keltner channel, it’s overbought: Mr. Market is manic, and we should avoid buying, no matter how tempting it feels. On the contrary, consider taking profits on long positions and look for shorting opportunities. When a stock sinks towards its lower Keltner channel, it is oversold: Mr. Market is depressed, and we should avoid shorting. On the contrary, consider taking profits on short positions and look for buying opportunities.
To add Keltner Channels to your chart, follow these steps:
1.) Find the “Overlays” area below the chart
2.) Click on the empty overlay dropdown box in that area and select “Keltner Channels” from the dropdown
3.) Type “26,2.7,26” into the “Parameters” box, replacing the default settings (Note: That is “twenty-six comma two point seven comma twenty-six”)
4.) Select “Dashed” from the “Style” dropdown
5.) Click the “Update” button
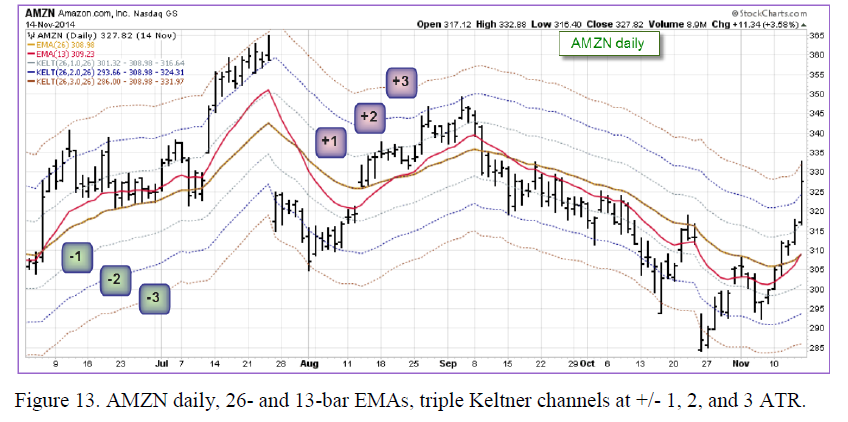
My partner in SpikeTrade.com Kerry Lovvorn likes to plot not one but three ATR channels on his charts. It is normal for prices to oscillate within +/- one ATR. They go to +/- two ATRs during healthy rallies and declines, but any move outside of +/- three ATRs tends to be unsustainable. There is an article on using Keltner channels, including Kerry’s method, in the free ChartSchool at StockCharts.com. Just enter “Keltner Channels” into the “Search” box on the right-side of the StockCharts homepage to find it.
A popular volatility-based channel is called Bollinger Bands – but popular doesn’t always mean the best. Bollinger Bands’ volatility makes them useful for options traders because prices of options are driven by volatility. Stock, index and futures traders are better off using more sedate Keltner channels.