Maximize your profit by copy Our Trade
There are different supply and demand zone patterns. Some of the more popular ones are shown below:
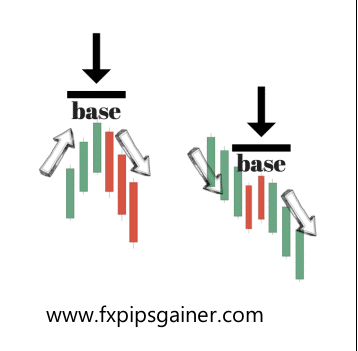
In this image, there are two potential
scenarios. In the first one on the left, we have price going down (D), then forming a base (B) and then going up (U) again. I will call this setup the DBU setup.
In the right image above, there is an uptrend (U) first. Then, we have the price forming a base (B) after which we have a continuation of the uptrend (U). I will call this setup UBU.
There are two possible setups when reviewing the supply and demand zones.

In the left image above, we have the prices going up (U), then forming a base (B) and then going down (D). I will call this the UBD setup.
In the right image above, we have price going
down (D), then forming a base (B) and after that it continues its fall down (D). This is the DBD setup.
So, the 4 setups (you don’t need to remember the abbreviations) are DBU, UBU, UBD and DBD. This is how you can identify the different supply and demand zones.
Maximize your profit by copy Our Trade
Recent Posts
- The 100% Profitable Trading Approach: Maximize Gains with Minimal Risk
- The Head and Shoulders Chart Pattern
- Bullish and Bearish Rejection Blocks: Identifying Key Trading Opportunities
- Just Market: Is It Worth Your Time and Money?
- Why LiteFinance Stands Out: A Comprehensive Review
- Understanding XAUUSD: Gold Strategy and Central Bank Reserve Management
- Hotforex Copy Trading Service
- Understanding Profit Factor: A Key Metric for Trading Success
- Supply and Demand Dynamics: How Gold Production Affects XAUUSD
- The Safe Haven: Gold as a Strategic Investment During Economic Downturns
- Mastering Deception: How to Scam as a Forex Signal Provider
- The Impact of Rising Bond Yields on Gold (XAUUSD)
- Understanding the Correlation Between Oil Prices and Gold (XAUUSD)
- The Impact of Geopolitical Events on Gold Demand (XAUUSD)
- Fundamental Strategy Overview: XAUUSD (Gold)
- Understanding the Role of Gold (XAUUSD) as an Inflation Hedge
- How Central Bank Interest Rates Influence Gold Demand
- Gold Holding Trading System
- From Novice to Pro: Navigating the ICT Propulsion Block in Trading
- Single Candle Order Block
- Is Scalping Right for You? Understanding the Advantages and Disadvantages
- The Dangers of Screenshot Trading: What You Need to Know
- Guidance for New Traders in Forex
- Forex Signal
- Understanding Market Psychology in Trading
- The Power of Order Blocks: Key Concepts Every Trader Should Know
- Understanding Imbalance and Fair Value Gaps (FVG)
- External and Internal Structure
- Causes of Market Pullbacks: What Every Investor Should Know
- Highs and Lows in Financial Markets: Key Concepts for Traders
- The Definitive Supply and Demand Trading Guide for Forex Traders
- Trading the Hanging Man with Pivot Points
- Trading the Hanging Man with Fibonacci Retracement
- Navigating Perfect Money: Pros and Cons You Need to Know
- Mastering the Super Signal Strategy with Donchian Channels
- Why Many Traders Lose in Forex: A Focus on Gold (XAU/USD)
- Beware of Forex Market Manipulation: Essential Insights for Traders
- Trading the Hanging Man with RSI Divergences
- The Forex Trader’s Blueprint: Understanding Supply and Demand Dynamics
- Trading the Hanging Man with Moving Averages
- Hanging Man Candlesticks Pattern
- Smart Money Concept(SMC) in Forex Market
- Advantages of Exness Forex Broker
- Trading the Hanging Man with Resistance Levels
- Bullish Harami Candlesticks Pattern
- Scalping Trading Strategy
- Trading with Confidence: A Closer Look at HFM Broker
- Swing Trading Strategy
- Breakout Trading Strategy
- XM Forex Broker: Your Gateway to Successful Trading


