Maximize your profit by copy our Trade
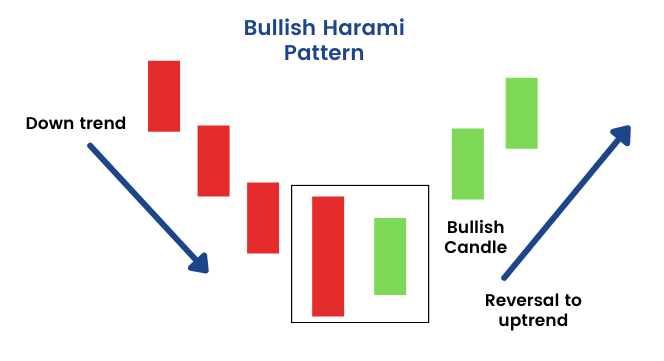
The bullish harami pattern is a significant formation in forex trading and technical analysis. It consists of two candlesticks that indicate a potential trend reversal from a bearish trend to a bullish trend. Traders often monitor this pattern closely as it can signal a good time to open a long position.
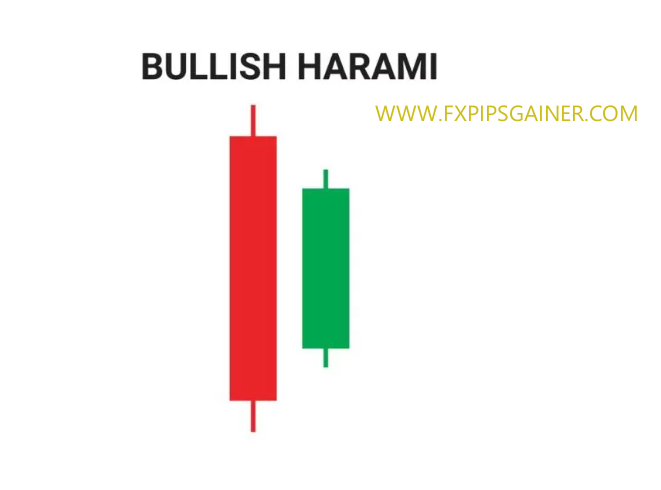
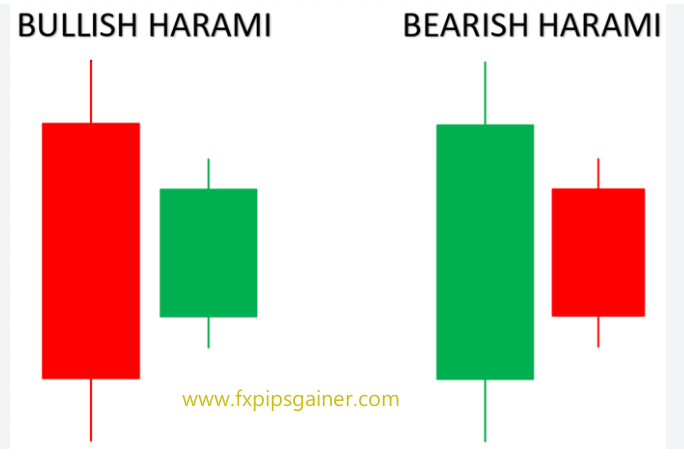
The term “harami” originates from an old Japanese word meaning “pregnant.” This metaphor is visually descriptive: the first candlestick is a large bearish candle, followed by a smaller bullish candle. The smaller bullish candle is “encased” within the body of the preceding bearish candle, reminiscent of a baby in a mother’s womb. This unique visual aspect is where the bullish harami pattern derives its intriguing name.

Components of a Bullish Harami Pattern
1. First Candlestick
Description: This is a long bearish candle that appears at the end of a downtrend.
Significance: The large real body indicates strong negative market sentiment and often reflects a continuation of the previous bearish trend. It represents significant selling pressure and sets the context for the potential reversal.
2. Second Candlestick
Description: This is a smaller bullish candle that opens higher than the previous day’s close but closes lower than the previous day’s open.
Engulfment: The second candle is completely engulfed within the body of the first candle, highlighting a shift in market dynamics.
Types: The second candle can be a white candle, a small green candle, or even a doji candle, which has nearly the same opening and closing prices. The presence of a doji indicates market indecision, contributing to the potential reversal narrative.
The bullish harami pattern is characterized by a large bearish candle followed by a smaller bullish candle, reflecting reduced selling pressure and a possible shift towards bullish sentiment.

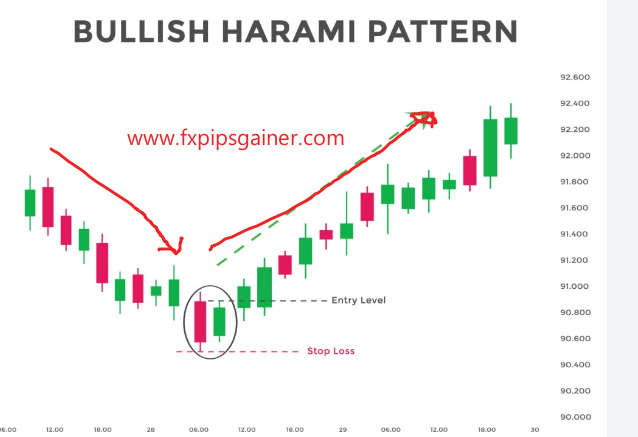
Recognizing a Bullish Harami Candlestick Pattern on a Stock Chart
Identifying a bullish harami on a stock chart is straightforward. Here are the key steps to recognize this pattern:
1. Look for the First Candlestick
You need to find a long bearish candlestick that signifies strong selling pressure. This candle should appear at the end of a downtrend.
2. Find the Second Candlestick
The next step is to locate a smaller bullish candle that follows the bearish candle. This smaller candle must be completely contained within the body of the first candlestick.
Key Considerations
- Pattern Context: Ensure that the bullish harami occurs after a downtrend, reinforcing the potential for a trend reversal.
- Corroboration with Other Indicators: While the bullish harami pattern can indicate a reversal, it’s essential to confirm its validity with other technical indicators before making any trading decisions. This might include moving averages, volume analysis, or momentum indicators.
Recognizing the bullish harami pattern can enhance your trading strategy, but always remember to incorporate additional analysis for more informed decision-making.

Understanding the Market Sentiment Behind the Bullish Harami Pattern
When a bullish harami appears at the end of a downtrend, it indicates a potential shift in market sentiment. The long bearish candle of the first day reflects that sellers are in control, driving the stock price lower. However, the emergence of a small bullish candle on the following day suggests that selling pressure is weakening and buyers are beginning to step in.
This pattern signals that the bears’ dominance is waning, hinting at a possible bullish reversal. It reflects a change in trader sentiment, indicating a potential shift in the price trend from bearish to bullish.
Trading the Bullish Harami Pattern
Identifying a bullish harami on your trading chart is a positive signal, but it’s important to understand that it is not an immediate call to action. While it suggests bullish potential, it should be confirmed before taking any trading steps.
Steps to Trade the Bullish Harami Pattern:
- Look for Confirmation: Wait for the price to break above the high of the harami’s second candle. A move above this level can indicate a good time to initiate a long position.
- Combine with Support Levels: If the bullish harami forms near a significant support level, this combination can enhance the reliability of the potential reversal.
- Use Additional Technical Indicators: Consider incorporating other technical indicators for further confirmation. Useful tools include:
- Trend lines
- Moving averages
- Oscillators
- Volume indicators
By understanding the market sentiment behind the bullish harami pattern and using confirmation strategies, traders can make more informed decisions when considering long positions.

Difference Between Bullish and Bearish Hammer
| Feature | Bearish Hammer | Bullish Hammer |
|---|---|---|
| Definition | A candlestick pattern indicating potential bearish reversal after an uptrend. | A candlestick pattern signaling potential bullish reversal after a downtrend. |
| Shape | Small body with a long lower wick and little to no upper wick. | Small body with a long lower wick and little to no upper wick. |
| Market Context | Appears after an uptrend. | Appears after a downtrend. |
| Color of Body | Typically red (bearish), but can be green (bullish). | Typically green (bullish), but can be red (bearish). |
| Interpretation | Indicates that sellers are starting to take control after buying pressure. | Indicates that buyers are stepping in after selling pressure. |
| Confirmation Needed | Usually needs confirmation from subsequent candlesticks or indicators. | Often requires confirmation from subsequent candlesticks or indicators. |
| Trading Implication | Potential sell signal if confirmed. | Potential buy signal if confirmed. |
Recent Posts
- How to Trade Supply and Demand Zones in Forex Using SMC Strategy
- Binary Trading vs Forex: Gambling or Real Business?
- Professional Copy Trading Service Using Real Money Accounts
- Why You Should Avoid Sell Entries in Gold Trading
- Safe Gold Trading Strategy for XM Micro Accounts (Up to 12 Entries)
- What is a Cent Account?
- Smart Money Concepts: Mastering Mitigation Blocks, Breaker Blocks & QML
- Understanding ICT Reclaimed Order Blocks: How Institutions Control Market Moves
- How to Trade Consolidations in Forex and Other Markets
- How to Identify Real Forex Traders vs Fake Screenshot Gurus
- The Gold Accumulation System – A Safe Buy-Only Strategy for Cent Accounts
- The Dark Side of Forex: How Screenshot Scammers Trap New Traders
- CHOCH vs MSS: The Exact Difference Every Smart Money Trader Must Know
- Gold Buy-and-Hold Strategy Using Cent Account and Compounding Lot Size (No SL Trading Model)
- How to Trade Order Flow Imbalances: Simple Rules for Spotting Buy & Sell Order Blocks
- Copy Our Long-Term Gold Trading Strategy
- Execution Mode vs Outcome Mode — The Professional Approach to Managing Trades
- How I Achieved 80.95% Profit in One Year on HFM Copy Trading
- Why It Took Me 15 Years to Become a Profitable Trader
- How to Read and Interpret Profit Factor in Forex Backtesting
- Understanding the Institutional Accumulation Channel
- Understanding No-Deposit Bonuses in Forex: What You Need to Know
- XAUUSD Analysis Summary
- Gold Price Surge Summary
- XAU/USD(GOLD) Analysis 07/10/2025
- Gold Market Update 07/10/2025
- Gold(XAUUSD) Market analysis 07/10/2025
- Start your journey to Forex success
- আপনার ফরেক্স সফলতার যাত্রা শুরু করুন
- 7 Money Rules for Financial Awareness and Peace of Mind
- Gold Recovers Ahead of Nonfarm Payrolls: Key Insights
- Weekly Market Wrap: Gold Pulls Back Amid Dollar and Bond Rotation
- Copy Our Trade with OneRoyal
- Finding Your Path: How to Choose the Perfect Forex Mentor for Success
- Experience the Stability of a 100% Secure Trading Account!
- The 100% Profitable Trading Approach: Maximize Gains with Minimal Risk
- The Head and Shoulders Chart Pattern
- Bullish and Bearish Rejection Blocks: Identifying Key Trading Opportunities
- Just Market: Is It Worth Your Time and Money?
- Why LiteFinance Stands Out: A Comprehensive Review
- Understanding XAUUSD: Gold Strategy and Central Bank Reserve Management
- Hotforex Copy Trading Service
- Understanding Profit Factor: A Key Metric for Trading Success
- Supply and Demand Dynamics: How Gold Production Affects XAUUSD
- The Safe Haven: Gold as a Strategic Investment During Economic Downturns
- Mastering Deception: How to Scam as a Forex Signal Provider
- The Impact of Rising Bond Yields on Gold (XAUUSD)
- Understanding the Correlation Between Oil Prices and Gold (XAUUSD)
- The Impact of Geopolitical Events on Gold Demand (XAUUSD)
- Fundamental Strategy Overview: XAUUSD (Gold)